Two landing pages receive the same budget. One produces twice the other page's click-through rate.
Traditional analytics show the outcome, but often miss its visual page context. Website heat maps expose where visitors click, scroll, pause, or encounter friction. This helps teams investigate weak performance without redesigning the entire page.
Over 15 years of building travel, retail, and logistics products at COAX Software, we’ve learned that clicks need context. A booking-button click may mean intent, confusion, or repeated failure. Device, interface state, and the next event distinguish them
One example is our retail client, Project A. The platform serves 120,000 monthly visitors and integrates both Hotjar (which has heatmap capabilities) and traditional Google Analytics. We also reduced its loading time from six to eight seconds to only 0.5 seconds. That outcome came from architecture work, not a measured heatmap intervention.
This guide explains how to use and interpret heatmaps and assesses six current tools. It also shows when a packaged product may not fit.
What is a website heat map?
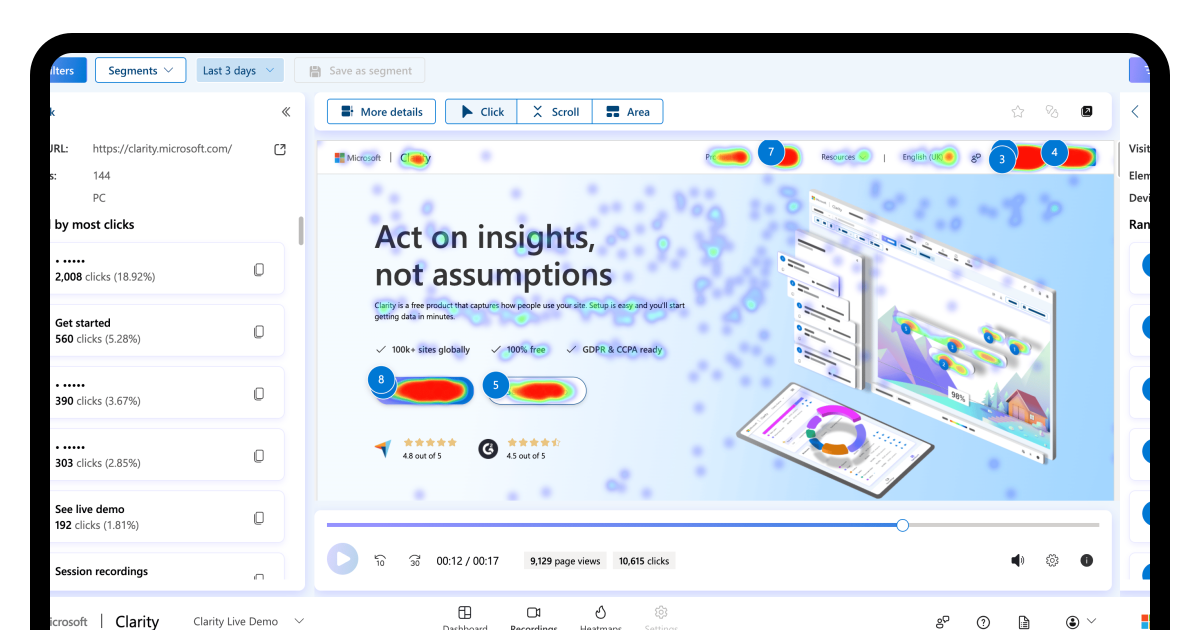
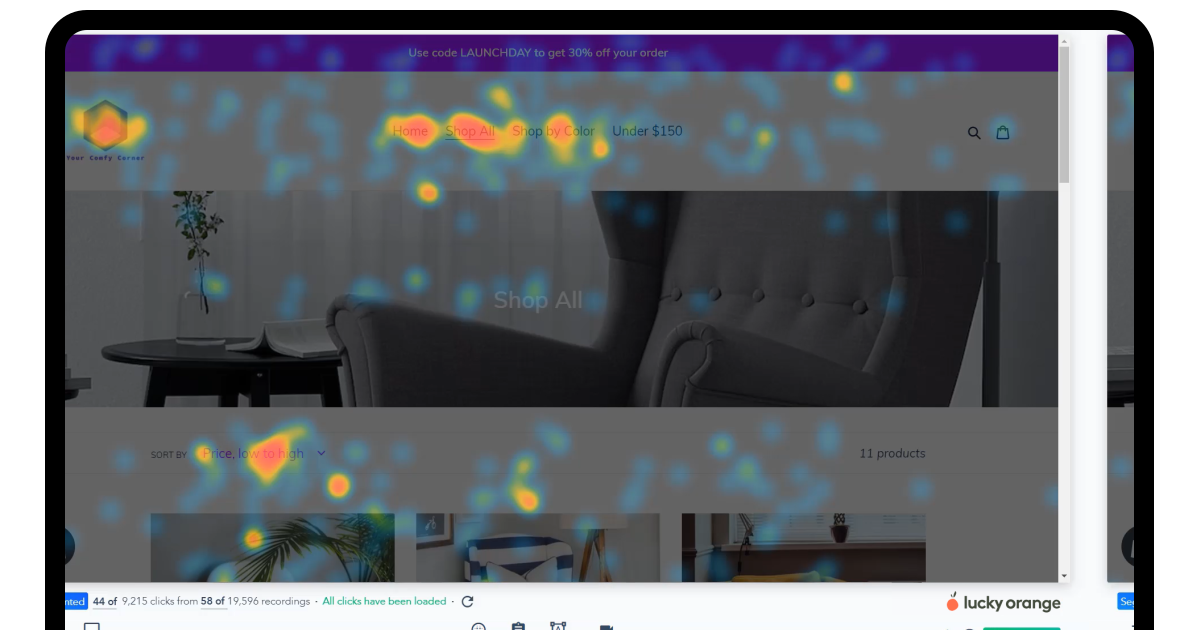
A website heat map overlays aggregated interaction or exposure data on a webpage. Warmer colors usually represent more activity, visibility, or time. Cooler colors represent less.
The visual layer makes patterns easier to spot than spreadsheets or event lists. However, each map represents a selected dataset, not every visitor.
Heatmaps show what happened, not why. Recordings, conversions, surveys, and interviews provide the missing context.
The wider market also shows how much conversion performance can vary. Contentsquare’s 2026 benchmark puts average conversion rates at 3.4% on desktop and 2% on mobile. In retail, the averages are 3.7% and 2%, respectively, while travel and hospitality reach 4.5% and 2.1%.
Treat these figures as reference points, not universal targets. They show it’s important to segment heatmaps by device and sector. A blended view can hide a mobile problem behind stronger desktop results. Teams can then frame focused tests to improve conversion rates.
Website heatmap types
A heatmap type describes the behavior or exposure shown in the visual layer. The most common options include:
Click maps: Show where visitors click or tap and which elements attract the most interactions.
Scroll maps: Show how far visitors move down a page and where exposure falls.
Move maps: Aggregate cursor positions, hovers, or paths on desktop interfaces.
Attention maps: Estimate how long different page sections remain visible.
Friction maps: Surface signals such as dead clicks, rage clicks, repeated fields, or errors.
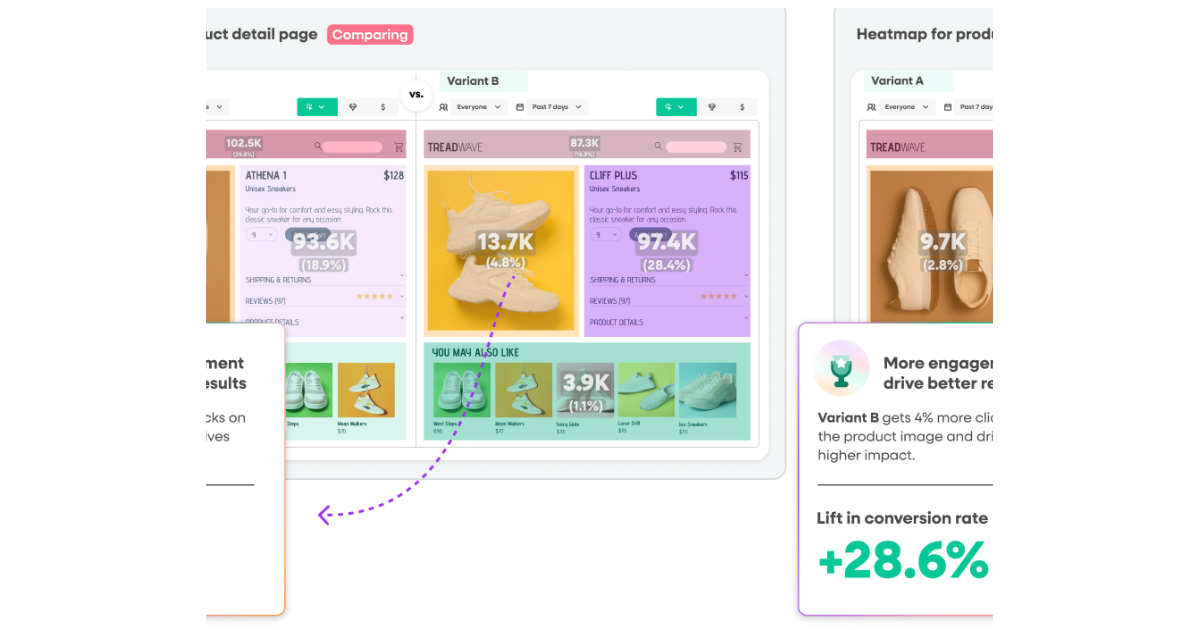
Segmented or comparison maps: Contrast patterns across devices, sources, regions, versions, or outcomes.
At COAX Software, we choose the type according to the product. Stateful interfaces need accurate click analysis, while content-heavy marketplaces benefit from scroll and attention maps. No single type explains a complete journey, so we compare the selected view with recordings and outcomes.
How does a website heatmap work?
Website heatmap software collects permitted browser events through a tracking script. The script may record clicks, taps, scroll depth, movement, visible time, or error-related actions
It connects those events to coordinates, page sections, or Document Object Model elements. The platform then aggregates selected sessions and places the resulting pattern over a page image. Available events, filters, and capture methods vary between products.
Many platforms extend beyond maps. They add recordings, funnels, surveys, error detection, segmentation, and automated summaries. These supporting tools help teams validate what the visual pattern suggests.
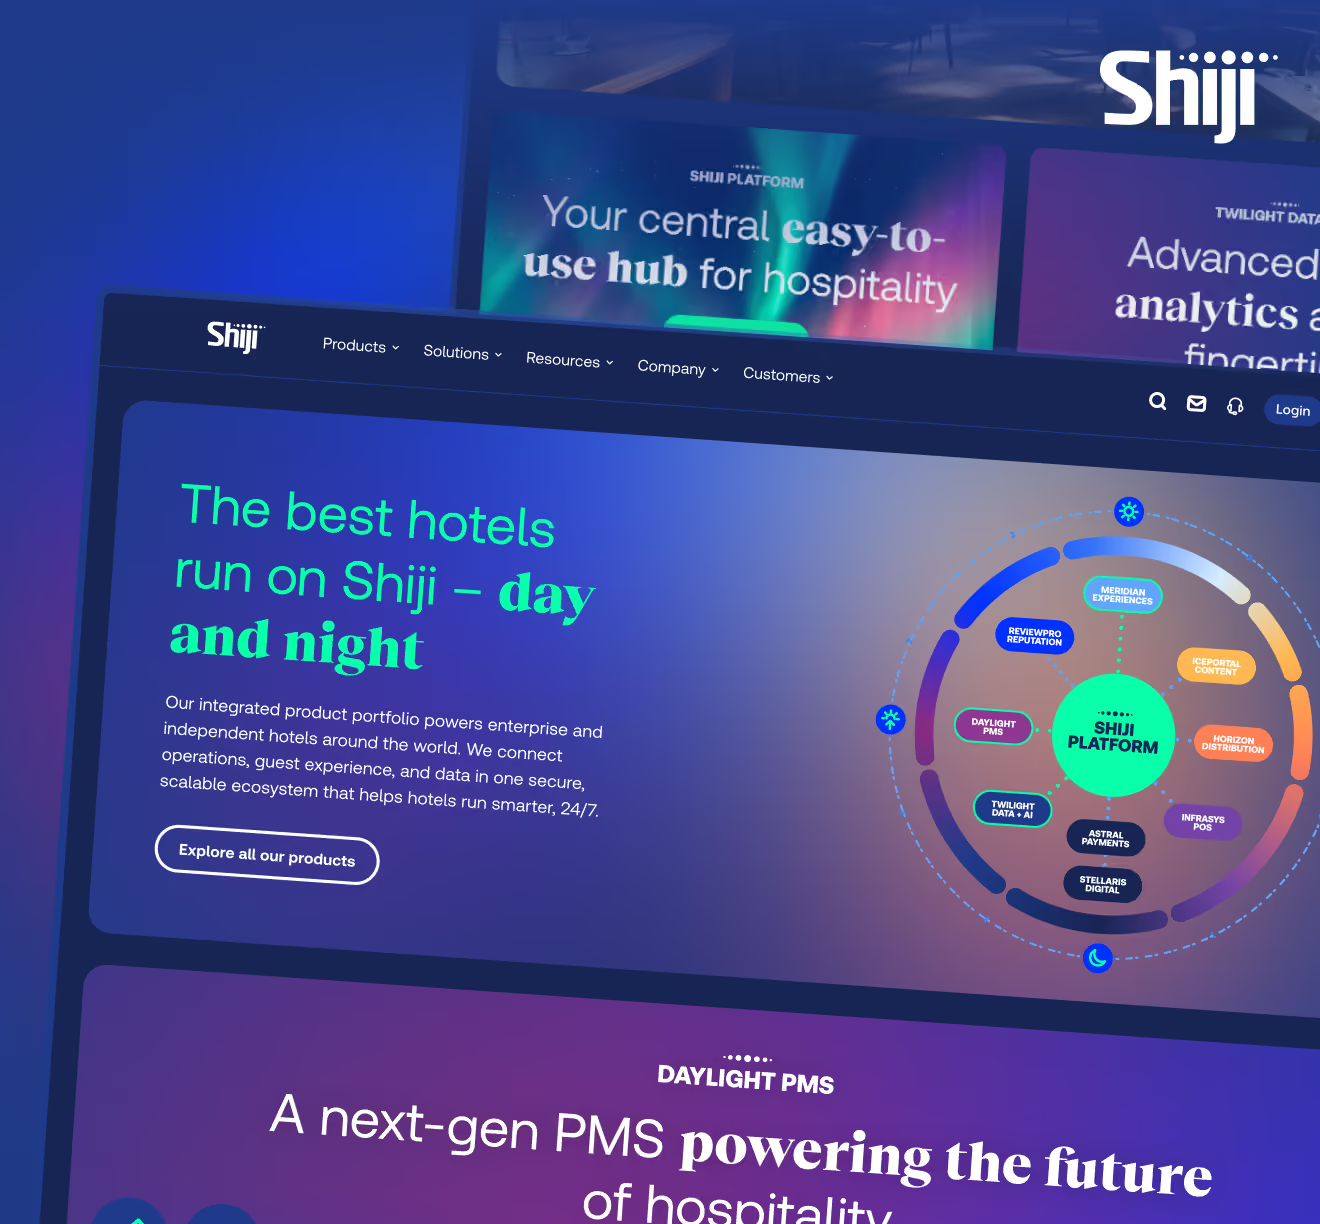
Our client in hospitality showed why page state matters. Their platform uses circular navigation that changes across devices and interaction states. A static screenshot may combine clicks from several pages, placing hotspots over the wrong control or empty space.
These differences make context important when interpreting apparent friction. Compare the map with representative recordings before changing the interface. Otherwise, clean-looking evidence may describe a page nobody actually saw.
Why use a website heatmap?
Heatmaps shorten the distance between a weak metric and a credible hypothesis. They help teams isolate a problem before committing development time.
The Nielsen Norman Group analyzed more than 130,000 eye fixations from 120 participants. Users spent about 57% of their viewing time above the fold.
They spent 74% within the first two screenfuls. These results don't define every page, but they show why placement deserves testing.
A Microsoft Clarity case study describes Conversion Pages' work across more than 200 landing pages. Only 41% of visitors reached one journal company's demonstration section.
The team moved that section higher. Its conversion rate rose 37%, while acquisition cost fell by over $12. The case combines heatmaps, recordings, and later page changes. It doesn't isolate heatmaps as the sole cause.
Teams usually apply heatmaps to five practical questions:
Find missed actions: Identify calls to action that visitors reach but rarely select.
Expose false controls: Locate images or labels that look clickable but aren't interactive.
Separate audience problems: Compare mobile, desktop, campaign, region, or conversion cohorts.
Prioritize investigations: Send suspicious patterns into recordings, analytics, or technical diagnostics.
Frame smaller tests: Change one supported element instead of rebuilding several sections.
These uses turn visual patterns into decisions. The map starts the investigation rather than ending it. That combined view supports customer journey optimization and a focused CRO audit. Every finding should finish with one measurable decision.
Who needs a website heatmap?
Heatmaps work best for teams that know a page underperforms but don’t know where the friction begins. They are especially useful for:
UX and CRO teams: Validate layout, hierarchy, and interaction hypotheses before broader redesigns.
Product teams: Compare feature use across devices, versions, and customer segments.
Marketing and content teams: Check whether campaign visitors reach and use the intended CTAs.
Ecommerce and booking teams: Investigate product discovery, forms, checkout steps, and partner redirects.
Developers and QA teams: Connect dead clicks, errors, or broken states with reproducible sessions.
At COAX Software, we find heatmaps most useful for products with recurring user journeys and enough traffic to compare relevant visitor groups. Teams should segment results by the aforementioned aspects and connect each pattern to a conversion event before making changes.
For low-traffic websites, we usually recommend interviews or moderated usability testing first. Heatmaps become more informative once enough comparable sessions reveal a stable pattern.
What metrics can you get from heatmaps?
Heatmap metrics are the values behind each visual pattern. Tools may measure the same metric differently. Check how each one calculates the value before comparing reports.
Click distribution
Click distribution shows where interaction concentrates and which elements receive the largest share. Depending on the platform, data may include total clicks, unique users, click percentages, first- or last-click data, and dead, rage, or error clicks.
The tracking method matters. Coordinate-based maps may misalign when layouts change, while element-based maps depend on stable selectors. Teams should also preserve device, viewport, version, and page-state context.
At COAX Software, we recommend not treating a high click count as proof that an element works. Instead, it’s best to compare it with the control’s state and the next user event. This helps separate genuine interest from repeated attempts to use a broken or unclear element.
Scroll depth
Scroll depth reports how far visitors move down a page. Common values include the percentage reaching every section, the average fold, exposure levels, and sharp changes across page depth.
These signals support content ordering, proof placement, and call-to-action testing. They don’t prove that visitors read every visible section. A sudden color change may reflect lost relevance, expandable content, a false floor, or a device-specific break.
COAX software treats low scroll depth as a signal to investigate, not to remove content immediately. We first separate desktop, tablet, and mobile data, then check recordings and conversion outcomes. This shows whether visitors lost interest or encountered a device-specific problem.
Mouse movement patterns
Mouse maps aggregate cursor positions, hovers, or paths. They may suggest hesitation or visually dominant areas on the desktop.
Mouse movements aren’t eye tracking. Touchscreens also lack the continuous cursor trail available on desktop devices.
A 2025 SIGIR study compared mouse and gaze data from 47 participants across 2.776 transactional Google searches. Average mouse and gaze positions differed by 373 pixels. The result applies to the Google results page, but the general pattern may be true for other websites.
During our time in the sphere, we have learned that cursor movement isn’t a substitute for eye tracking. It’s best to treat it as supporting evidence during a UX audit, alongside clicks, recordings, and conversion outcomes. Any decision should rely on several signals, not cursor position alone.
Time-based interaction metrics
Time-based metrics show how long visitors take to discover, consider, or act on different page elements.
Depending on the platform, reports may include time before hover, hover duration, hover order, time to click, average visible time, and the share of a session spent on a section. These values help separate immediate interaction from delayed discovery or consideration
However, these values don’t explain the cause. A long delay before a click may indicate poor visibility, but it may also mean the visitor was reading or comparing options. Hover metrics also apply mainly to pointer devices, not touchscreens.
No product wins for every team. The right choice depends on the decision, traffic, page behavior, privacy needs, and existing analytics stack.
We reviewed official documentation and pricing on 12 August 2026. If you are reading this later, the pricing or feature availability may differ. These selections describe buyer fit, not measured performance.
Tool
Entry option
Best fit
Main trade-off
Microsoft Clarity
Free
Baseline discovery
Dynamic-section and per-map limits
Contentsquare
Free for 200,000 monthly sessions
Cross-functional teams
Advanced analysis requires paid access
Mouseflow
Free for 500 monthly sessions
Forms and friction
Free access covers limited features
Crazy Egg
Free
Page-level CRO
Deeper reports and testing require payment
Fullstory
Free for 30,000 monthly sessions
Product and engineering teams
Advanced analytics require paid access
Lucky Orange
$32 monthly, billed annually
Small ecommerce teams
Costs rise with tracked traffic
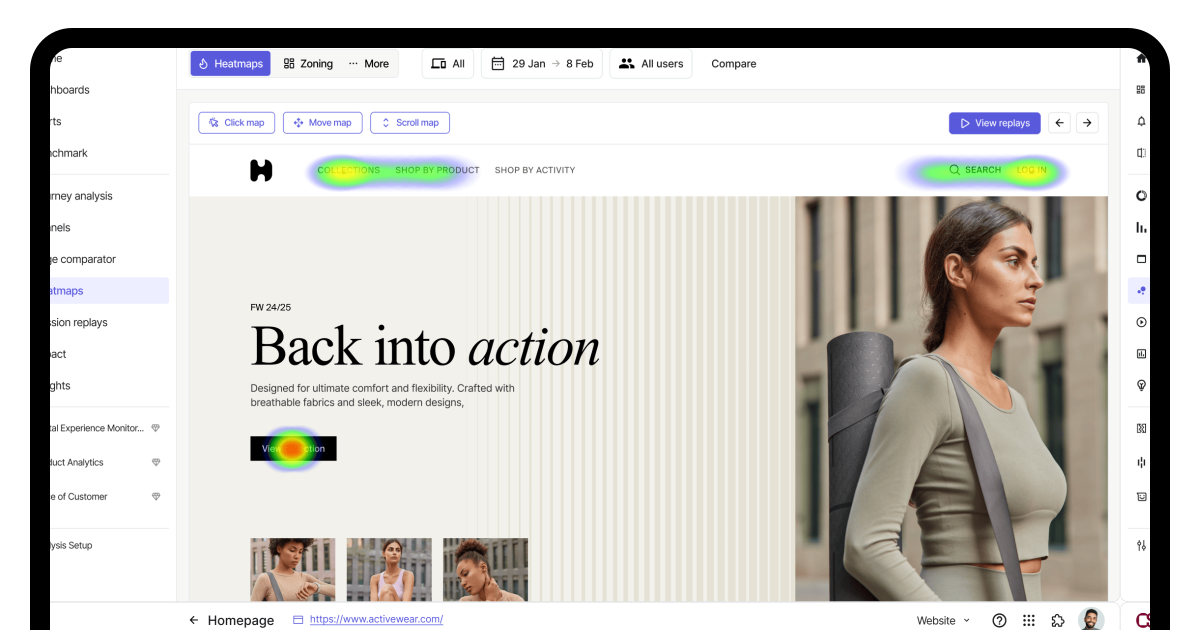
Microsoft Clarity is the best free option for baseline discovery, with five heatmap categories and session recordings. However, dynamic elements, nested scroll containers, and the 100,000-pageview limit require careful validation.
Contentsquare suits cross-functional teams needing heatmaps, replay, journeys, surveys, and product analytics in one platform. Its free plan covers 200,000 monthly sessions, but smaller teams may face unnecessary setup overhead.
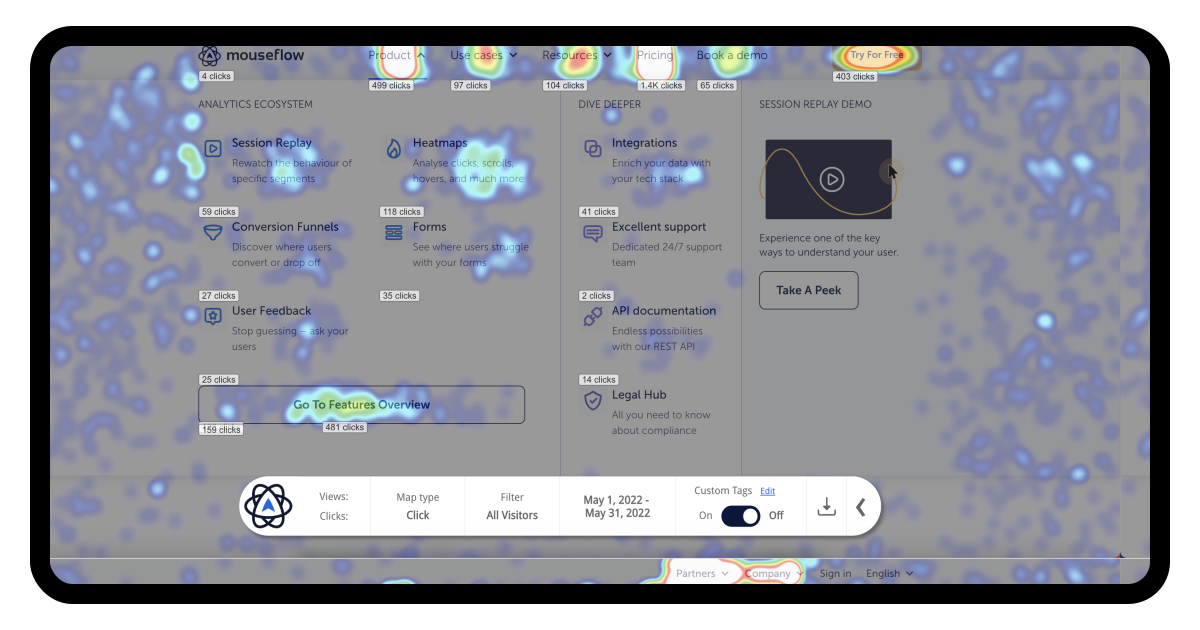
Mouseflow works best for diagnosing forms, funnels, and friction through seven heatmap types and session recordings. Its free plan covers 500 monthly sessions with one-month retention, so busy sites may need paid capacity.
Crazy Egg suits page-level CRO with Heatmap, Scrollmap, Confetti, Overlay, and List reports. Its free plan includes Click, Scroll, and Confetti, while paid plans add deeper analysis and experimentation.
Fullstory suits product and engineering teams that need behavioral and technical context. Its click and scroll maps support conversion, order-value, and revenue overlays. The free plan includes 30,000 monthly sessions.
Lucky Orange suits small ecommerce teams needing dynamic heatmaps, recordings, form analytics, surveys, and live chat. Annual plans start at $32 monthly for 3,500 sessions, but growing traffic raises costs.
How to choose website heatmap software
A long feature list doesn't guarantee a successful implementation. Start with one decision, then assess capture accuracy, privacy, coverage, and workflow fit.
Match the tool to the decision
Choose the evidence your decision requires, not the platform with the longest feature page. Different problems require different signals.
Checkout abandonment needs form analytics and replay. Content placement needs scroll or attention maps. Application debugging needs errors, events, and state-aware recordings.
At COAX Software, we connect each map to one outcome before tracking begins. This keeps research, debugging, and experimentation from becoming one vague project.
It also prevents teams from paying for reports nobody owns. Every planned map should have a question, an owner, and an outcome metric.
Test dynamic-page accuracy
Single-page applications, menus, modals, carousels, and personalized blocks change without a full reload. Merged states may place hotspots on the wrong element.
Shiji required complex animations and responsive circular navigation. A comparable implementation needs pilot testing across every important state and device.
Compare each overlay with representative recordings before trusting the aggregate pattern. Repeat this check after major interface releases.
Review privacy, consent, and masking
Heatmap scripts may process text, clicks, URLs, and page structure. Review masking, exclusions, deletion, residency, retention, consent, and role-based access.
Vendor defaults aren't a substitute for your data map. Checkout, account, and booking routes require stricter controls than public pages.
The UK ICO requires prior consent for non-exempt storage or access technologies. It also requires a positive action before those technologies activate.
Applicable duties vary by tool, configuration, purpose, and jurisdiction. Regional counsel should confirm your consent and processing requirements.
Calculate sampling, retention, and real cost
Session allowances look generous until teams divide them by page, device, campaign, and customer type. Retention, projects, seats, and modules may also change costs.
Project A serves 120,000 monthly visitors. If each generated one session, 500 sessions would cover about 0.42% of that volume.
This calculation illustrates coverage. Returning visitors and excluded routes would change the result.
Estimate the smallest valuable cohort before buying a plan. A cheap allowance becomes expensive when it removes the audience behind your decision.
Connect heatmaps to the team’s workflow
Useful maps feed the analytics and delivery systems teams already use. Check event integrations, exports, APIs, experiment links, and role controls.
Our retail client integrates with both Hotjar and Google Analytics. A pairing like this can connect visible behavior with exits, traffic sources, and conversions.
We favor tools that preserve this relationship and make findings easy to assign. Reports have little operational value until an owner can turn them into a backlog item or test.
Plan setup, reading, and validation
A reliable heat mapping website workflow starts with one conversion question and ends with one measured decision. Select the page, audience, and stable collection window.
Assign an owner before collection. Then define which recording, event, or outcome will validate each pattern.
Our approach follows lo:live’s phased discipline. Release a controlled change, observe live behavior, compare outcomes, and document the result.
How to read heatmap data?
Effective heatmap analysis starts with a specific question, not the warmest color on the page. Confirm the dataset before interpreting the visible pattern.
1. Check the map’s scope and page state
A hotspot only describes activity within the selected dataset. Check the session count, date range, filters, viewport, URL rules, and screenshot.
Split data when the interface changed during collection. Otherwise, one map may combine incompatible versions or states.
For a stateful interface, like Shiji, compare the map with recordings. Confirm that each click matches the control visitors actually saw.
2. Compare related signals
Read click, scroll, attention, and friction data together rather than treating one map as a conclusion. One map rarely provides enough evidence for a decision.
A call to action can't receive clicks when visitors never reach it. Repeated clicks may indicate popularity or an unresponsive control.
Pair maps with analytics to check the next event. Then open recordings when the visible pattern and conversion outcome disagree.
3. Turn the pattern into a testable hypothesis
Document the observation before proposing a cause. A useful hypothesis separates measured evidence from the team's interpretation.
Record these elements:
Page: Name the exact URL, version, or interface state.
Cohort: Define the device, source, region, or customer segment.
Pattern: Describe the measured behavior without interpreting its cause.
Evidence: Add related maps, recordings, events, errors, or survey responses.
Cause: State the explanation the team intends to test.
Metric: Choose the event or business outcome that confirms improvement.
This structure makes assumptions visible. It also stops a colorful pattern from becoming an unsupported conclusion.
4. Turn the pattern into a testable hypothesis
Change one element capable of confirming or rejecting the explanation. Avoid redesigning several sections before the evidence improves.
Prioritize findings by reach, business impact, confidence, and implementation effort. Record both positive and negative results.
On lo:live, COAX Software used phased releases and real-user feedback to refine workflows. The same discipline keeps heatmap-led changes measurable and reversible.
How to create a website heatmap?
Heatmap tools generate the visual layer after receiving permitted interaction data. Your team must define the question, protect users, and verify capture.
1. Define the page, audience, and outcome
Start with one page-level question and the event that would answer it. Choose the URL or interface state, target audience, device groups, collection window, and required map types. Also, identify routes and fields that must not be captured.
At COAX Software, we define the conversion question before website heatmap tracking begins. A booking form, content page, and application dashboard need different events and cohorts. A narrow scope produces cleaner evidence. It also prevents collection without a decision owner.
2. Configure and install the tracking
Set consent, masking, exclusions, access roles, and retention before activating the script. Add the vendor snippet through the codebase or an approved tag manager, and load it asynchronously when supported. Single-page applications may also need route and state tracking configured.
COAX Software treats a heatmap script as a production integration. Developers and QA check its loading behavior, consent states, and performance impact. On checkout, account, or booking routes, we don't rely on vendor defaults to protect sensitive fields.
3. Verify capture before collecting data
Test the setup across important devices, browsers, and interface states before trusting the website heat map. Open menus, modals, dropdowns, and carousels; follow route changes; confirm masking; and check that clicks appear over the correct elements. Compare sample recordings with the aggregate view.
For a dynamic product like Shiji, it makes sense to repeat this validation after major interface releases. Once capture is accurate, keep the page and campaign conditions reasonably stable until the pattern stops changing materially. Record the configuration so that later maps remain comparable.
FAQ
How much traffic does a website heatmap need?
No universal session minimum applies. Analyze mobile and desktop traffic separately. Use comparable collection windows until each cohort’s main pattern remains stable. Then confirm the findings against conversions and representative recording.
Does website heatmap software slow down a website?
It can. Most heatmap tools add third-party JavaScript and network requests. Google’s web.dev guidance explains that such scripts can increase network overhead and delay rendering when loaded synchronously. Use the vendor’s non-blocking installation method, remove duplicate trackers, and measure Core Web Vitals before and after deployment.
What can heat mapping not prove about visitors?
Heat mapping can't prove why visitors acted, whether they were satisfied, or where they looked. Cursor heatmaps can indicate interaction patterns, but they can’t show exactly where visitors looked.
How often should teams review website heat maps?
Review heatmaps after launches, campaigns, or meaningful metric changes. Stable pages don't need arbitrary weekly reviews. Compare equivalent periods before drawing conclusions.
Are heatmaps safe for website checkout pages?
Build custom heatmap analytics only when configured products can't meet a critical requirement. Common triggers include inaccurate state capture, mandatory data residency, or proprietary event relationships.
Compare lifecycle cost, security, documentation, maintenance, and ownership before building. A custom map still needs consent, validation, segmentation, and outcome data.




































































We are interested in your opinion