A driver's eyelids drop for half a second on a dark interstate at 2 a.m. Nothing happens. No crash, no claim, no report. Just a moment nobody would've caught, until a fleet's system flagged that exact pattern forty times in a single quarter, before a single violation occurred. That gap between "nothing happened" and "something almost did" is what driver risk management is for.
After 16 years in transportation and logistics tech, COAX Software teams know the risk of a single accident. Or something that almost became one. Something gathering like a storm. And we also know how to prevent storms from happening, on a scale.
Way too many fleets still measure safety by counting what went wrong. This article looks at a different approach. We'll walk through what driver risk assessment and management mean, and which technologies make the difference. You'll also see what a strong risk management solution should include, and how to build a strategy that future-proofs your business.
What is driver risk management?
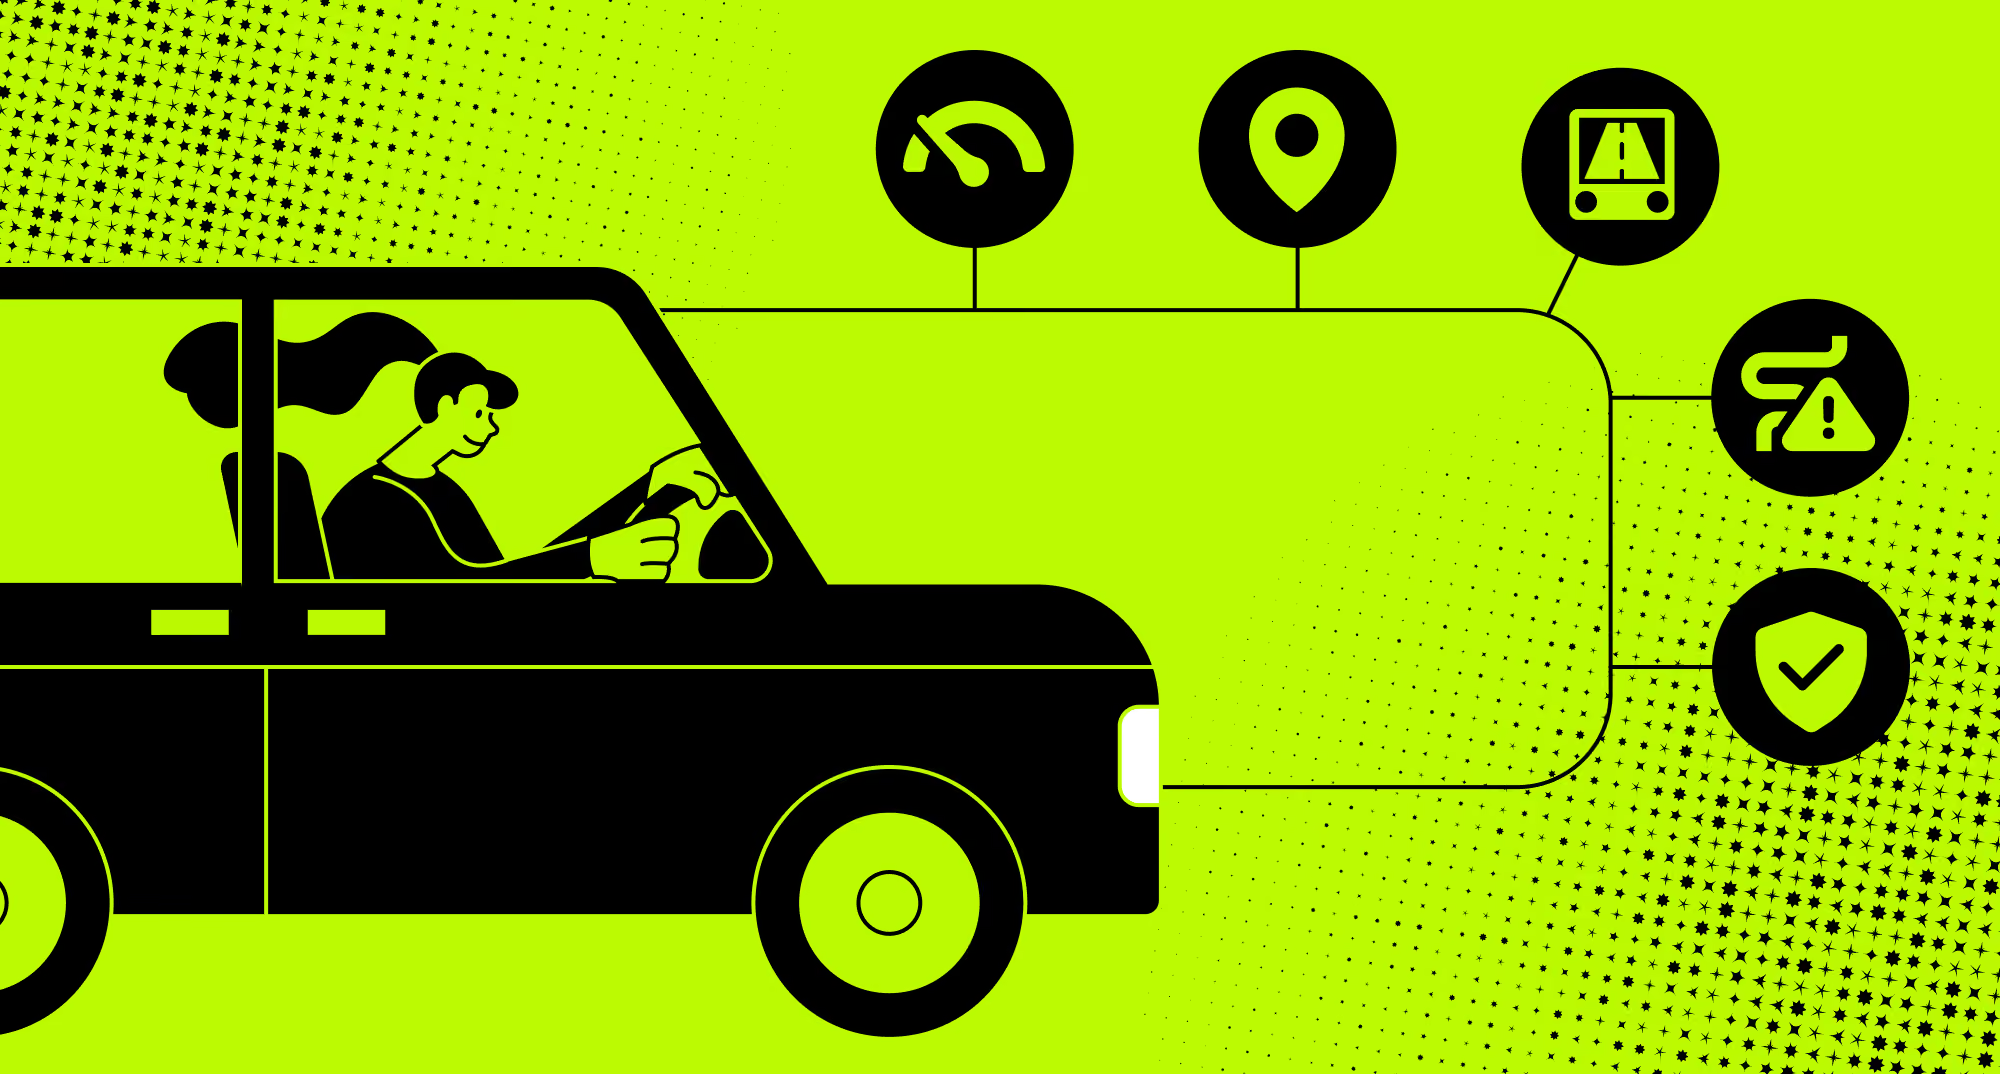
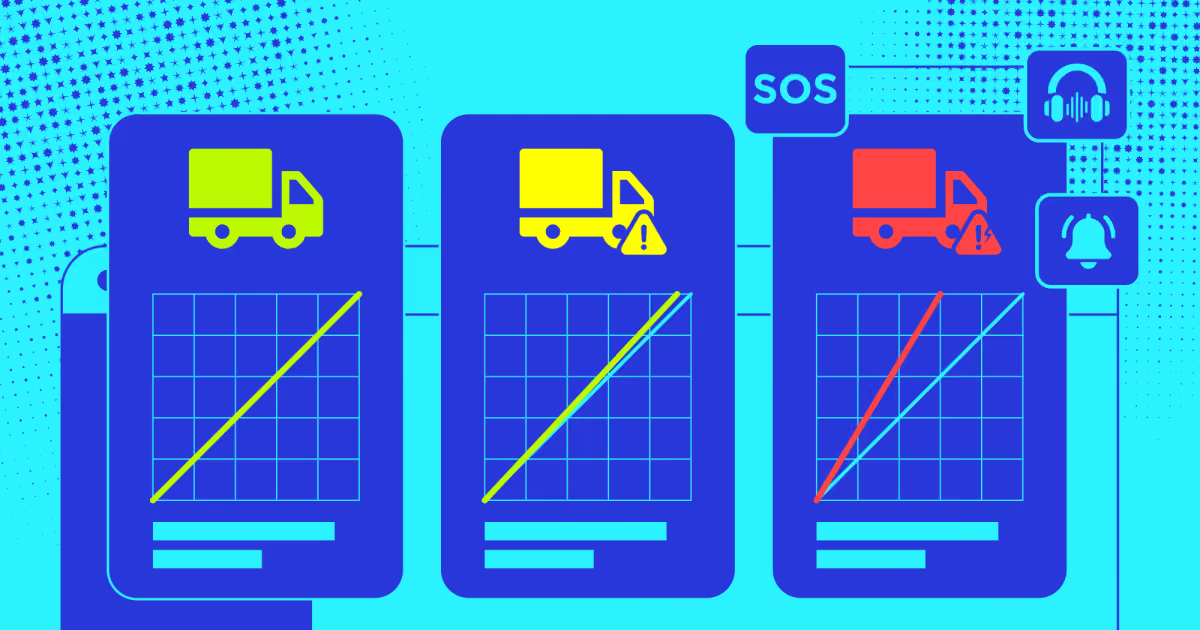
Driver risk management is the ongoing process of identifying, scoring, and reducing the factors that make a crash more likely. It doesn't wait for an incident. It works from behavior, patterns, and context, tracked continuously across every shift.
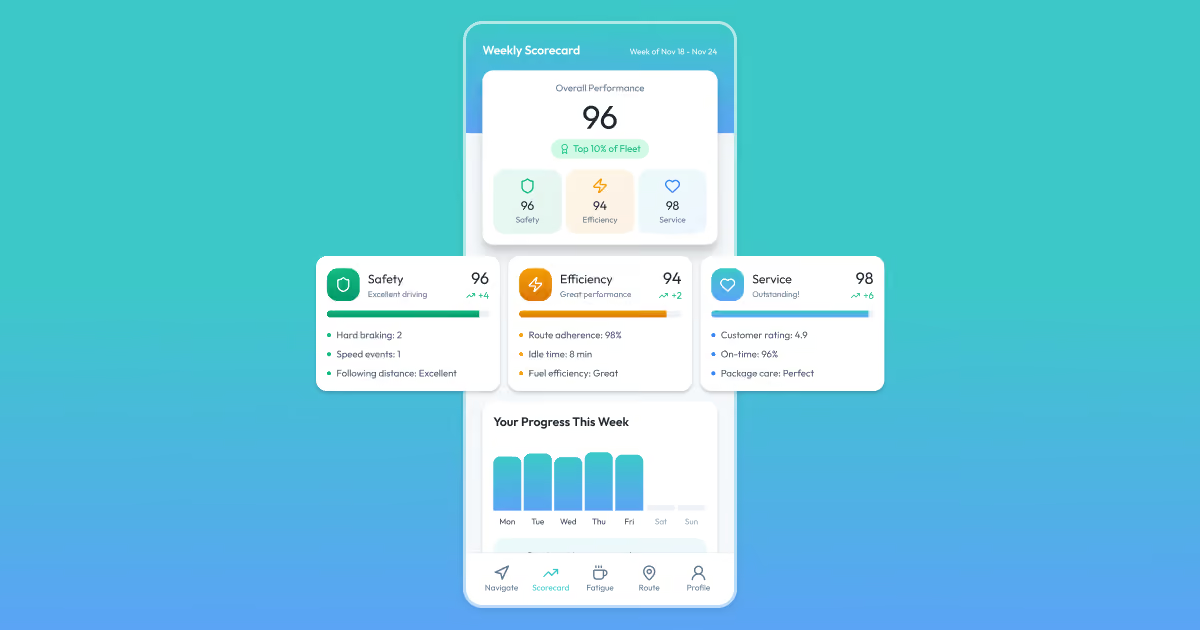
On the DriveIQ platform we built for a cross-border carrier, this showed up in a small but telling detail. Drivers ignored their first scorecards completely. The moment the format switched from raw scores to peer ranking, engagement climbed on its own. That single shift said something bigger: risk management only works if drivers actually open the app.
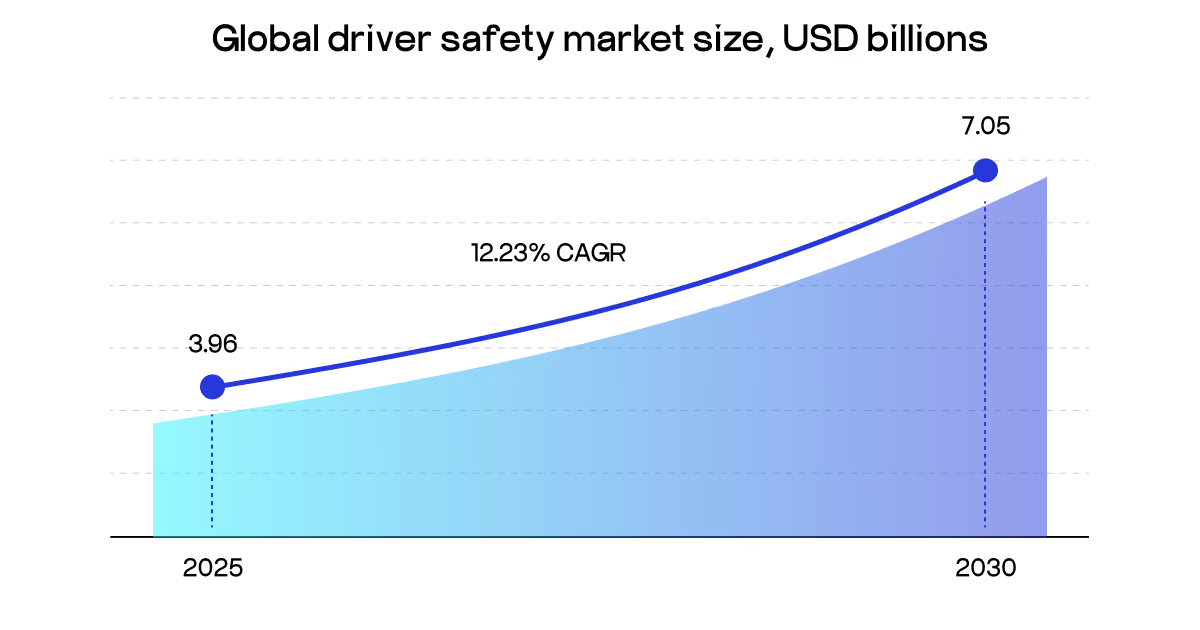
The market backs the urgency here. The global driver safety market was at $3.96 billion in 2025 and is projected to hit $7.05 billion by 2030. Regulatory pressure is a major driver. Euro NCAP's 2025 protocol and the US FMVSS No. 127 standard are turning driver monitoring from optional to mandatory. Commercial fleets are adopting fastest, since safer driving translates directly into lower insurance premiums.
Here's why that connection matters more than it sounds. Speed and accident risk follow a measurable, almost physical relationship. Raise average speed by just one kilometer per hour, and crash numbers can climb between one and five percent. The reasoning is simple neuroscience. Your brain needs time to notice a hazard, decide, then react. At higher speed, that same reaction window covers more ground before you've even touched the brake.
Braking distance itself scales with the square of speed, not speed itself. Double your speed, and stopping takes four times the distance. That's not a policy detail. It's physics working against a high-risk driver before any judgment call comes into play.
This is the piece accident counts miss entirely. They tell you a crash happened. They don't tell you the ten seconds of speed drift that made it inevitable. Driver risk management exists to close exactly that blind spot, before it turns into a police report.
Why is focusing on accidents only a losing game?
Two fleets can run the same routes and see the world completely differently. One waits for something to break. The other watches every small signal building toward it. The gap between them explains why accident counts alone can't run a safety program.
Fleet A treats safety as a scoreboard. Someone reviews incidents once a month, files a report, and moves on. Nothing changes until the next crash forces a conversation. Between incidents, the fleet is flying blind, with no visibility into the near misses piling up quietly.
Fleet B treats safety as a live feed. Hard-braking events, fatigue signals, and speed drift get flagged the moment they happen. Dispatchers see risk building hours before it becomes a claim. Nothing here waits for damage to justify attention.
Our cross-border client started as Fleet A. Dispatchers only heard about a problem after a customer called. Moving to continuous monitoring meant adding one specific capability: a fatigue and hours-of-service optimizer that reads shift length and time of day together. It flagged high-risk windows early enough for dispatchers to reassign the route, not just document what went wrong afterward.
The pattern is consistent across every fleet we've worked with. Fleet driver risk management built on continuous signals catches problems a monthly review never would. That's the foundation of real fleet safety management: not more paperwork after a crash, but visibility before one happens.
Factor
Accident-only fleet
Continuous monitoring fleet
Detection timing
After the incident
Before the incident
Data volume
Low, incidents are rare
High, behavior data flows daily
Root cause visibility
Limited to what's reported
Clustered by pattern and context
Driver coaching
Reactive, after a write-up
Ongoing, based on real trends
Typical outcome
Repeat incidents, slow improvement
Fewer incidents, earlier correction
Timing. Accidents surface risk after the damage is done. Behavioral signals surface it while there's still time to intervene.
Volume. True accidents are rare, so they give you a thin, incomplete picture. Near misses and harsh-braking events happen constantly, generating real data to act on.
Root cause. A crash report tells you what happened. It rarely tells you the habit, the fatigue level, or the blind spot that caused it.
Modern driver risk management solutions are built around this exact shift. They don't replace judgment. They just make sure a dispatcher never has to guess where the risk is hiding.
What is driver risk assessment?
Driver risk assessment is the scoring process behind driver risk management. It looks at behavior, history, and context together. Then it turns that data into one risk score per driver. That score tells a dispatcher who needs coaching first.
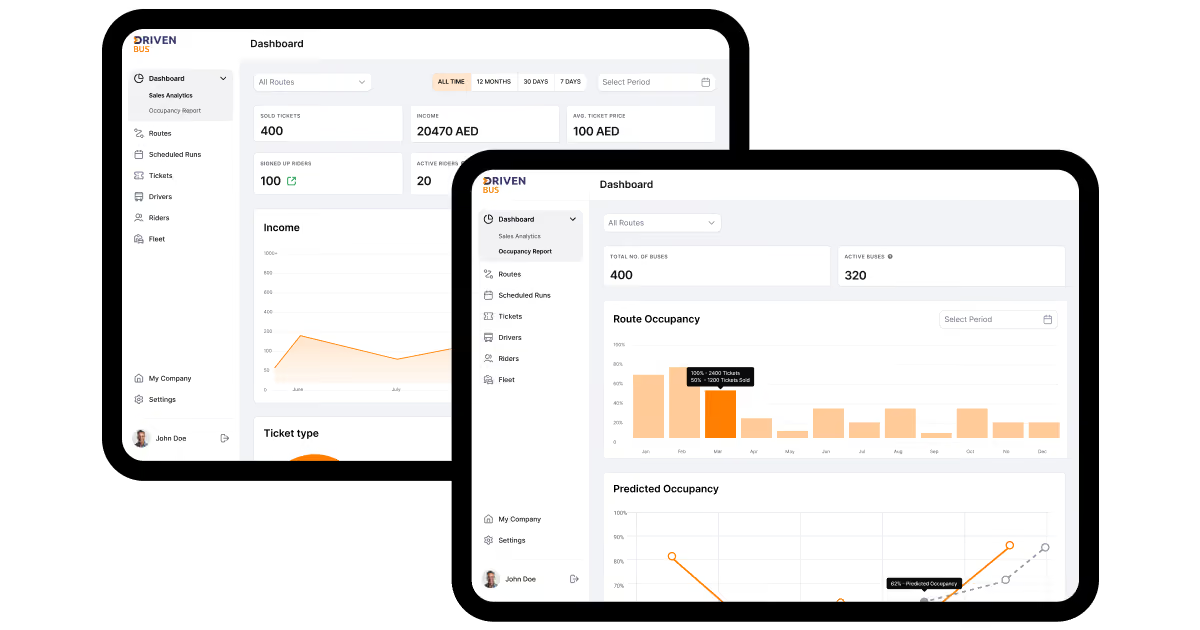
Not every platform calls this out by name. Take DrivenBus, a transit platform we built for Dubai. It tracks driver punctuality, passenger ratings, and route completion rates. Those aren't formal risk scores, but the instinct matches. You measure behavior before you react to it. That's fleet driver risk assessment in practice, even outside long-haul trucking.
"Assessment only works if it's continuous. A score from three months ago tells you nothing about today's risk," says Orest Falchuk, Head of Engineering at COAX Software.
Why is driver risk assessment a must for your business?
Driver risk assessment matters because it protects your budget, not just your safety record. Continuous scoring catches cost drivers before they show up on an invoice. Fuel waste, harsh braking, and idle time all cost money quietly.
The numbers confirm it’s true. Over a quarter of large fleets report saving at least $4,000 per truck annually through data analysis. Nearly 30% cut costs by at least $1,000 per truck.
Higher satisfaction: drivers report less stress with better navigation guidance.
Each of those gains traces back to patterns, not accidents. This is where assessment earns its keep.
Accidents are rare, so they teach you little on their own. Behavioral patterns show up daily, long before a claim does. A single hard-braking event means nothing. Forty of them in a month, clustered around the same route, mean something.
We saw this directly on DriveIQ, our driver risk management software built for a cross-border carrier. Continuous assessment, not accident counts, drove a 38% drop in safety incidents.
The same fleet management solutions approach applies whether you run ten trucks or ten thousand. Consistent online driver risk assessment turns scattered signals into something a dispatcher can act on that day.
How it fits into a broader risk management strategy
Driver risk assessment doesn't stand alone. It's the input that feeds every other part of the strategy. A score means nothing if nobody acts on it. The real value shows up in what happens next.
Think of it as a loop, not a report. Assessment scores feed coaching priorities. Coaching outcomes feed policy updates. Policy updates change what gets scored next. Each stage depends on the one before it.
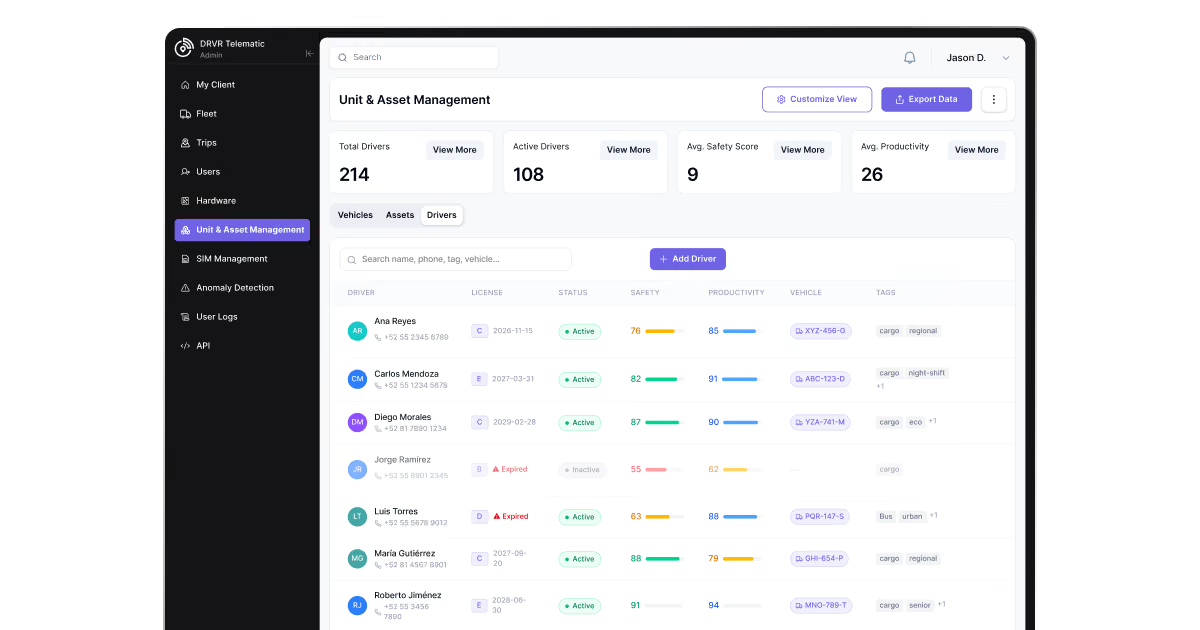
Scoring. The system pulls behavior, history, and context into one number. That number ranks every driver by current risk level. On DriveIQ, this ranking replaced a static monthly review entirely.
Coaching prioritization. Dispatchers see who needs attention first, not everyone at once. High scores trigger a conversation before the pattern repeats. Low scores confirm what's already working.
Policy adjustment. Patterns across many drivers reveal gaps in the rules themselves. A cluster of speed violations on one route might mean a bad schedule, not bad drivers. The policy shifts to match reality.
Continuous re-scoring. Yesterday's score doesn't apply to today's shift. Fatigue, weather, and route changes shift risk hour by hour. The loop only holds if scoring never stops.
Each stage above only works if the next one follows through, which is why the loop breaks the moment coaching or policy sits idle on old scores.
None of this depends entirely on software. A dispatcher who reads the data and calls a driver still matters more than the algorithm. Driver risk management stays a human decision at its core, even when the data is perfect. But the right tech makes that decision faster, and a lot harder to get wrong.
Some driver risk assessment examples make this concrete. A fatigue score that flags a driver at hour ten of a shift, before dispatch assigns another route. A speed-drift pattern clustered on one stretch of interstate, pointing to a schedule problem, not a driver problem. Each example ties a number back to a decision someone actually made.
This is why we built DriveIQ's exception queue around live scores, not periodic snapshots. A strategy built on stale numbers protects nobody. One built on continuous assessment gives every other safety decision something real to stand on.
Which factors should be included in a driver risk assessment?
A weak assessment misses half the picture. Track the wrong factors, and a high risk driver slips through unnoticed until a claim lands. Track the right ones, and patterns show up weeks before an incident does. Motive's 2026 road safety report found seven near-collisions occur for every actual collision, each one a signal these factors are meant to catch. That's the entire case for building a driver risk assessment framework around more than just accident history.
Driving history and violations
Past tickets predict future ones better than almost anything else you can measure. A citation from last month tells you more than a clean record from five years back. Your brain doesn't forget habits that fast, and neither should your scoring.
Speeding tickets. Each one signals a driver who treats the limit as optional, not a rule.
License points. Points accumulate for a reason. Watch the trend, not just the total.
Prior suspensions. A lapsed license once is a red flag. Twice is a pattern.
At-fault findings. These carry more weight than a no-fault fender bender ever will.
Pull motor vehicle records twice a year at minimum. Once at hire isn't enough. People change lanes, jobs, and habits faster than paperwork catches up.
Accident and claims records
Raw counts hide the story. A rear-end at a red light and a lane departure on the interstate get logged the same way in most systems. Yet, they point to completely different problems of high risk drivers. One's about following distance. The other's about attention drifting somewhere it shouldn't.
Group claims by cause, not by date. That's the difference between a spreadsheet and something you can act on. A cluster of low-speed parking-lot dents means something about mirrors or backup cameras. A cluster of highway claims means something about fatigue or route design. Same fleet, two entirely different fixes.
Hours of service and fatigue patterns
Fatigue works on the brain the same way alcohol does, just slower and quieter. Reaction time stretches. Peripheral vision narrows. Motive's data puts collision rates near three a.m. at almost triple the midday level, and that's not a coincidence. That's just biology fighting the clock.
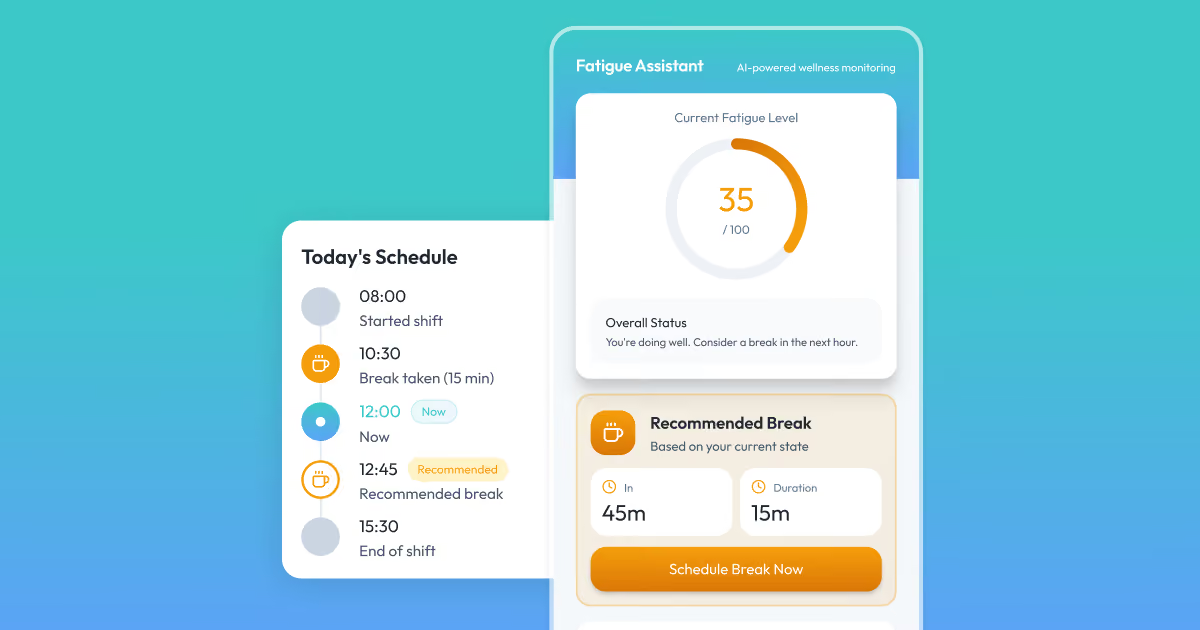
The body's circadian rhythm bottoms out overnight regardless of how alert someone feels. A driver ten hours into a shift processes a sudden brake light slower than one two hours in, even if both swear they're fine. On DriveIQ, this exact window drove the case for a dedicated fatigue optimizer that reads shift length against time of day. It flagged risk hours before dispatch would've noticed anything on paper.
Telematics and driving behavior data
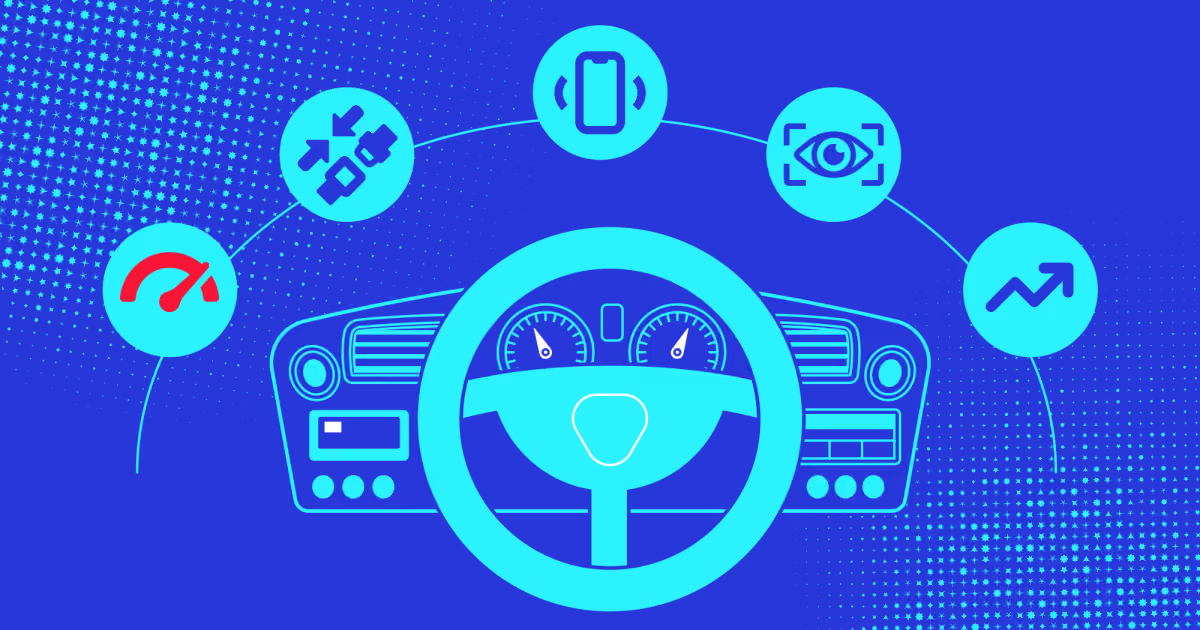
Harsh braking and sudden swerving rarely happen in isolation. They cluster, then a collision follows. Drivers involved in a collision were 25% more likely to have hard-cornered beforehand, according to Motive. The body reveals stress before the mind admits it: a tense grip, a late brake, a swerve that's really a startle response to something noticed too late.
Hard-braking events. Frequent spikes suggest following too close, not bad luck.
Speed variance. Sudden drops and surges point to distraction, not traffic.
Lane-departure alerts. These often precede drowsiness by minutes, not seconds.
Cellphone-use flags. Motive found violations spike between four and six p.m., right as drowsiness climbs too.
For instance, our SyncMatix telematics integration reads this driver risk behavior straight from the vehicle in real time, not from a report filed after the fact.
Vehicle and route context
The same driver can look risky on one route and fine on another. Context changes the math every time, and driver risk management solutions need to see them all. A tight delivery window through a construction-heavy corridor stresses even a careful driver into rushing a turn or skipping a check.
Think about a familiar commute in heavy rain versus a clear afternoon. Same driver, same car, wildly different risk. Routes with frequent left turns across traffic, poor lighting, or aggressive local drivers carry baseline risk no amount of training erases. Driven Connect's route management ties this context back to each trip automatically, so a spike in incidents on one corridor doesn't get pinned on the driver by mistake.
Training and compliance records
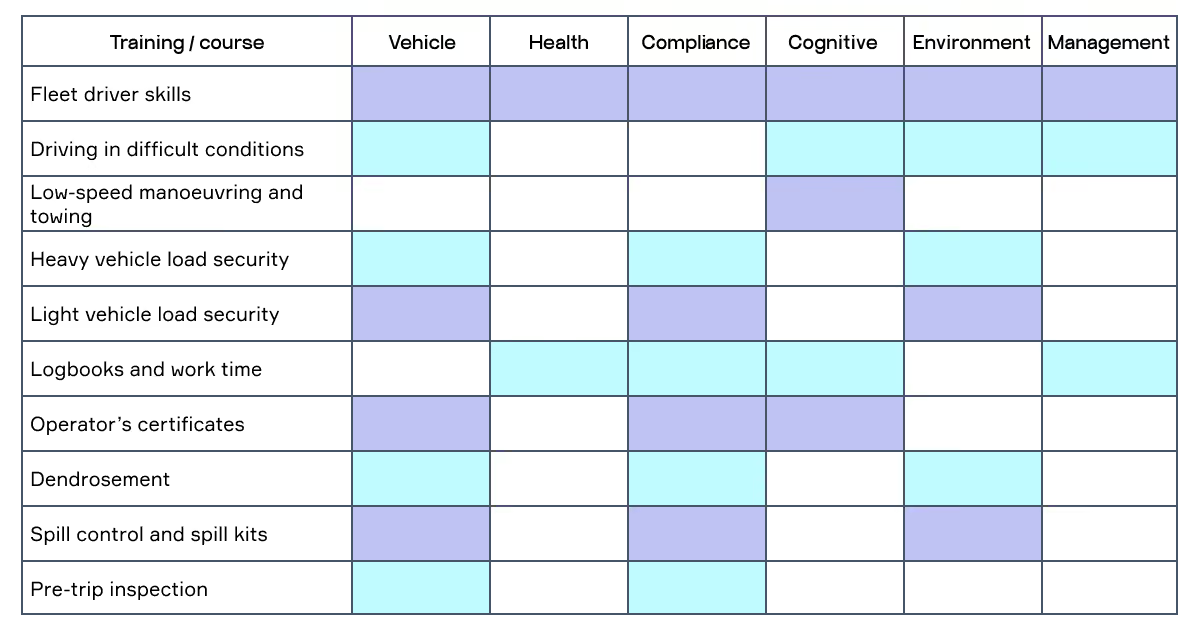
Certifications tell you where the gaps sit, and the gaps aren't random. Look at what's actually being taught and where it maps. All these elements separate a real driver risk management system from a checklist nobody opens.
Fleet driver skills and driving in difficult conditions. These cover vehicle handling and cognitive load together, the split-second decisions that matter most in rain or ice.
Low-speed maneuvering and towing. Purely cognitive and spatial. This is about judging clearance, not reaction speed.
Heavy and light vehicle load security. Compliance-heavy, with real consequences if a shifted load throws off braking distance mid-route.
Logbooks and work time. Health and management overlap here directly, tying back to the fatigue patterns above.
Spill control and endorsement. Environmental and compliance training that most fleets only think about after an incident.
Pre-trip inspection and in-cab assessment. Cognitive and environmental awareness, checked before the engine even turns over.
A driver missing spill-control training carries a different risk profile than one missing a load-security course. Neither shows up in an accident count. Both show up the moment you map training against these categories.
None of these six factors means much sitting alone in a spreadsheet. Combined, they turn scattered records into something a dispatcher can actually read: usable driver risk reports, not a pile of disconnected numbers.
Which technologies help manage driver risk more effectively?
A dispatcher's phone buzzes at 5 a.m. One driver's just logged a third hard-brake event in an hour, and the system already flagged it before dispatch even opened the app. AI cross-referenced that pattern against shift length, route history, and time of day, then ranked the alert above forty quieter ones sitting in the queue. That's the whole workflow in one moment: sensors capture behavior, software scores it, and a human decides what happens next.
AI and machine learning
AI doesn't replace judgment here. It filters noise so a dispatcher sees the signal first. Most of the real value shows up in one narrow job: turning messy paperwork into structured data a system can actually score.
Document extraction. OCR tools like AWS Textract and Rekognition pull data from bills of lading, manifests, and compliance forms.
Pattern detection. Machine learning clusters harsh-braking events, speed drift, and fatigue signals into one readable score.
Natural language queries. LLMs let a dispatcher ask a plain question and get a plain answer, no dashboard required.
Route optimization gets credited to AI constantly, but that's mostly classical operations research doing the math. Where language models genuinely earn their spot is different: turning unstructured paperwork into something a driver risk management software platform can score. We wrap existing models rather than train our own from scratch. Time-to-market matters more than owning the model.
"Most fleet data is still too messy to hand a model full autonomy. It's assistance, not a replacement for a dispatcher's call," says Orest Falchuk, Head of Engineering at COAX Software.
Telematics and GPS tracking
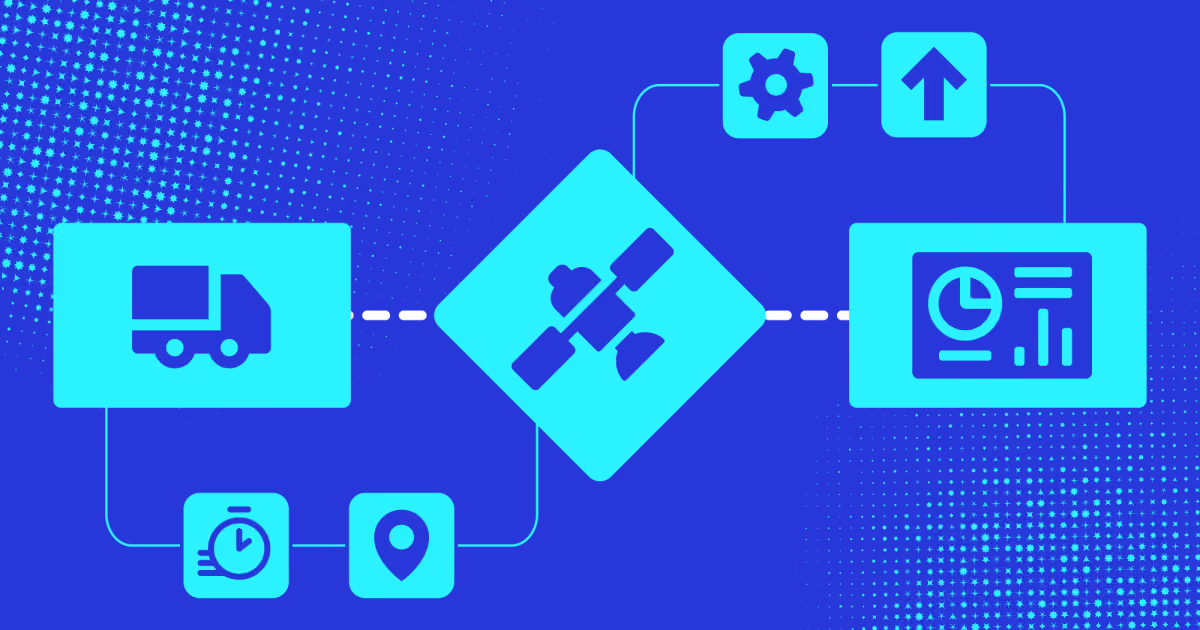
Telematics is the nervous system of any driver risk management program. Sensors read speed, braking force, and location dozens of times per second. Nothing about this data waits for a driver to file a report.
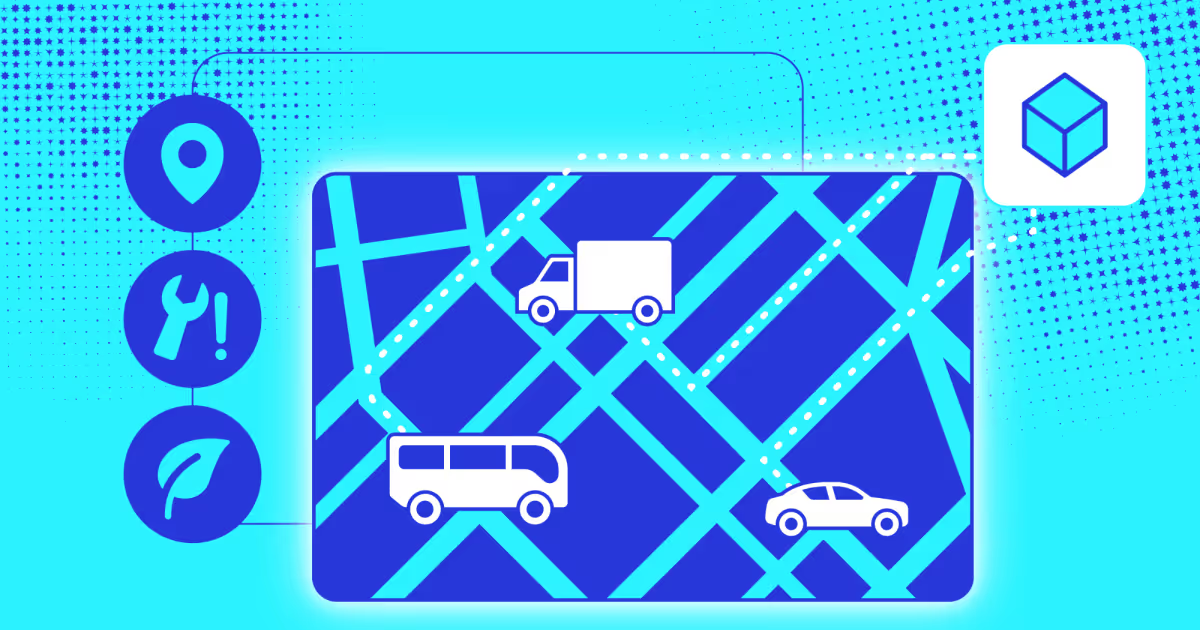
GPS adds the where to the what. A hard-brake event means one thing on a straight highway and something else at a blind intersection. Route context turns a raw data point into something a dispatcher can actually act on.
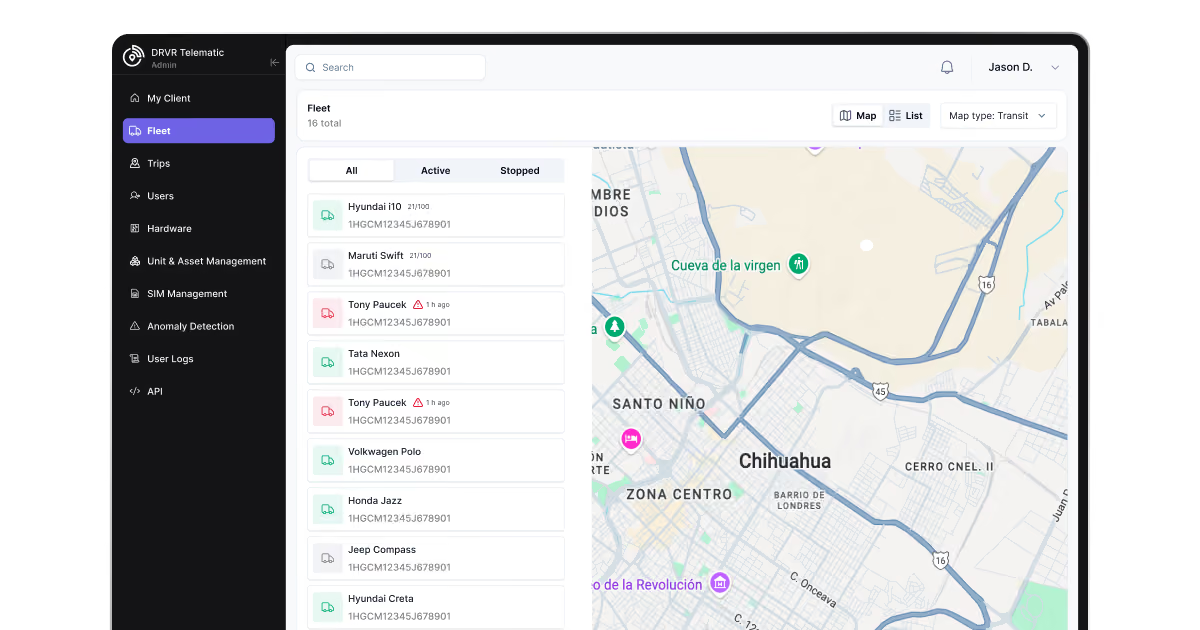
For example, take a situation when a cross-border delivery truck triggers a hard-brake alert in the SyncMatix solution we built. The dispatcher instantly sees whether it happened in heavy traffic at a toll plaza or on an empty stretch of highway. By stitching location pings and speed data straight into the fleet manager’s alert feed, we eliminated manual lookups across separate tools and gave dispatchers the context to act immediately.
Dashcams and computer vision
Cameras catch what sensors alone miss: the face, not just the wheel. Motive's road safety report drew on 1.2 billion hours of dashcam footage across commercial drivers. Drowsiness and distraction, not road conditions, showed up as the strongest predictors of collisions.
Computer vision reads micro-signals a person would need hours to notice manually. Eyelid droop. Head tilt. A hand reaching for a phone. Seven near-collisions happen for every actual one, and vision-based systems are what surface them before they become a claim.
On our telematics project, we built a dedicated dashboard interface to turn these video signals into clear, actionable metrics. Fleet operators track real-time safety scores, flag risky driving trends across 200+ active drivers, and intervene long before a near-miss turns into an expensive claim.
Predictive risk scoring and analytics
Scoring is where every data stream converges into one number. Telematics, violation history, and fatigue patterns feed a single model. That model ranks drivers by risk level, updated continuously, not once a quarter.
Building this in-house rarely makes sense for a mid-size fleet. Traditional ML frameworks like scikit-learn or TensorFlow still sit at an early trial stage across most of the industry, ours included. Wrapping a proven model and feeding it clean data beats building one from zero. The right driver risk management tools don't need a custom algorithm to work well. They need consistent, well-labeled input.
Cloud infrastructure and system integrations
None of this works if the pieces don't talk to each other. A fleet running four legacy systems that don't share data isn't unusual. It's the default starting point on most projects we take on.
Simple integrations. Off-the-shelf automation tools like Zapier cover basic data handoffs between systems.
Managed cloud. A modular monolith on AWS keeps one backend serving separate driver and dispatch apps.
Auth limits, rate caps, and mismatched data formats are recurring friction on almost every integration project. None of them derails a build alone, but ignoring all three at once will. That's the gap most driver risk management solutions quietly fail to close.
Mobile driver apps
The best backend in the world does nothing if a driver never opens the app. On DriveIQ, raw scorecards got ignored completely. The moment the format switched to peer ranking, engagement climbed without any extra push from management.
People respond to comparison faster than they respond to a number in isolation. Seeing a colleague rank higher triggers something more direct than a score ever will. A strong driver risk assessment program depends on that adoption curve as much as it depends on the data behind it.
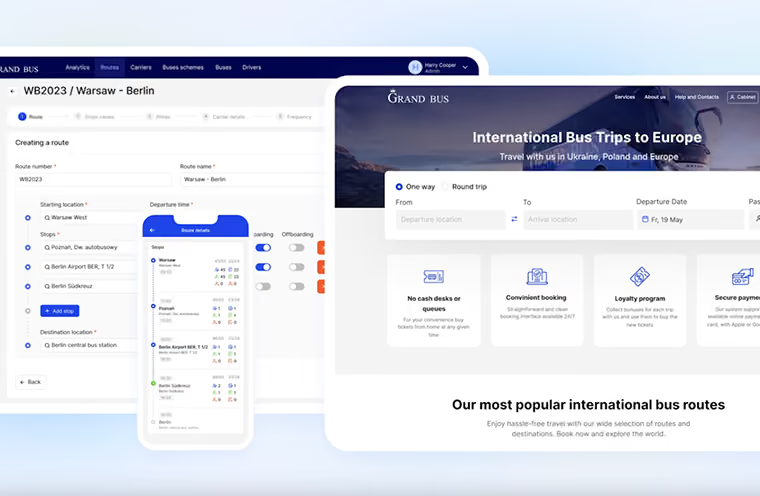
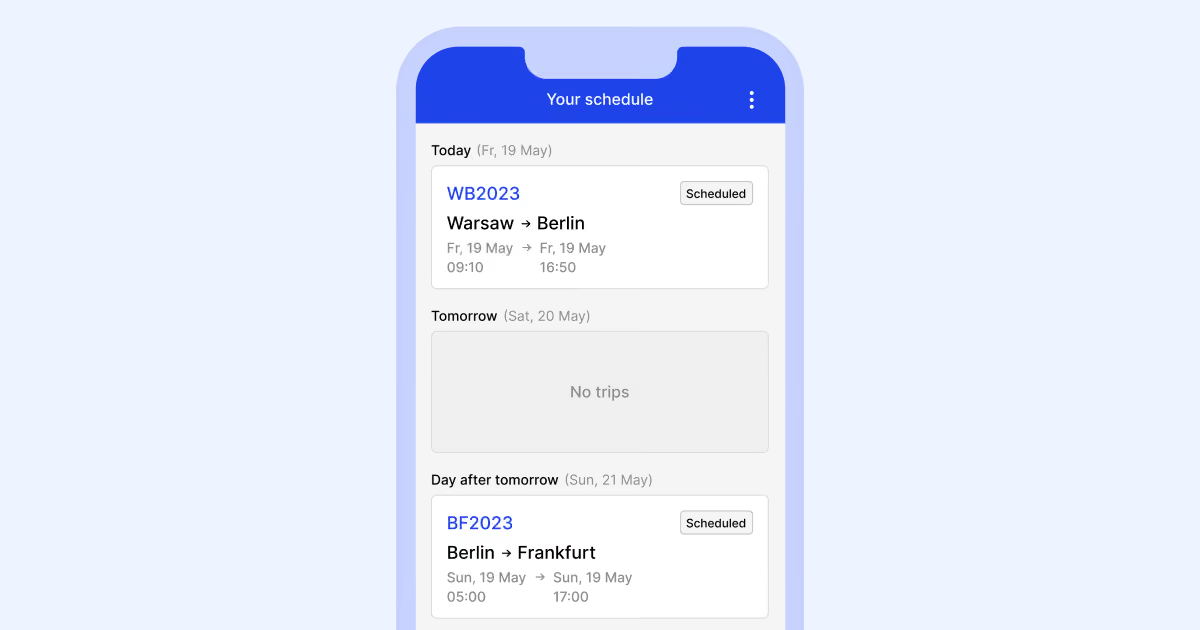
For GrandBus, we swapped pen-and-paper tracking for a lightweight driver app that handles QR-code ticket scans, on-the-spot passenger check-ins, and live route status updates. Cutting out Excel logs and phone check-ins trimmed passenger tracking calls from 35% down to 5% per route. This keeps drivers focused on the road while feeding real-time updates to the backend.
What are the main components of a driver risk management solution?
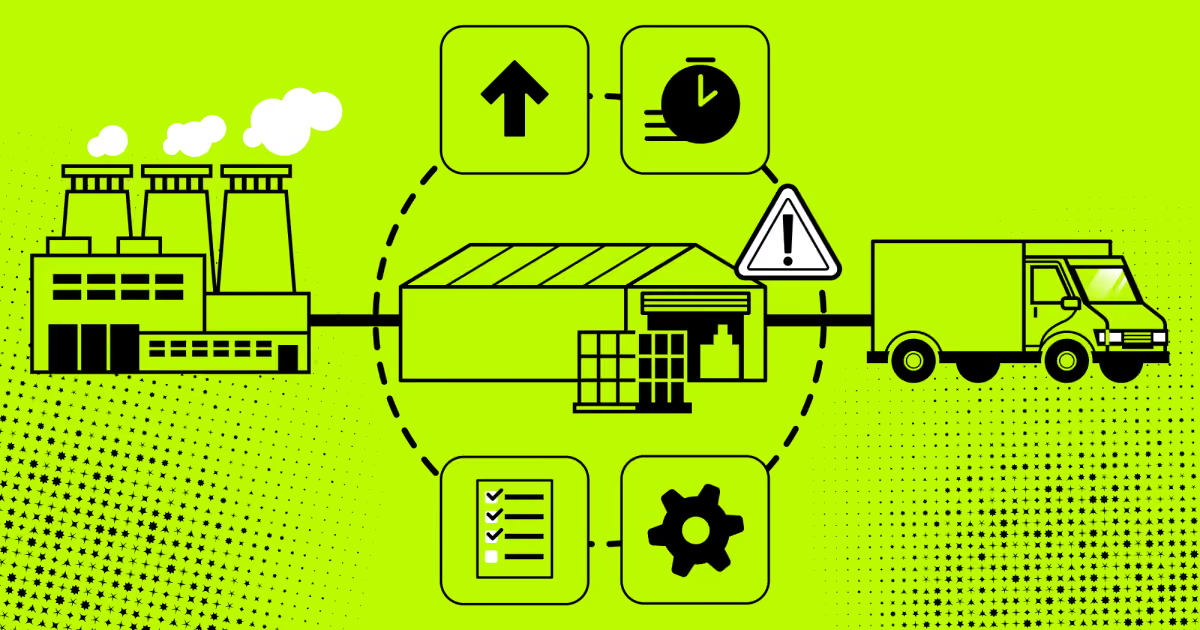
A driver's license lapses on a Tuesday. The system catches it before dispatch assigns Wednesday's route. That's six components working as one: screening flags the gap, telematics confirms the vehicle's idle, a scorecard updates itself, coaching gets assigned, and a dashboard shows the fix happened. No single piece does this alone. That's the whole point of building driver risk management as a system, not a stack of separate tools.
Driver screening and credential monitoring.
This layer checks who's legally allowed behind the wheel, continuously. It pulls license status and MVR data on a recurring cycle, not just at hire. Most platforms run this against state DMV databases and flag lapses within days, not months. You get a live compliance record instead of a filing cabinet full of outdated paperwork.
Telematics and GPS tracking.
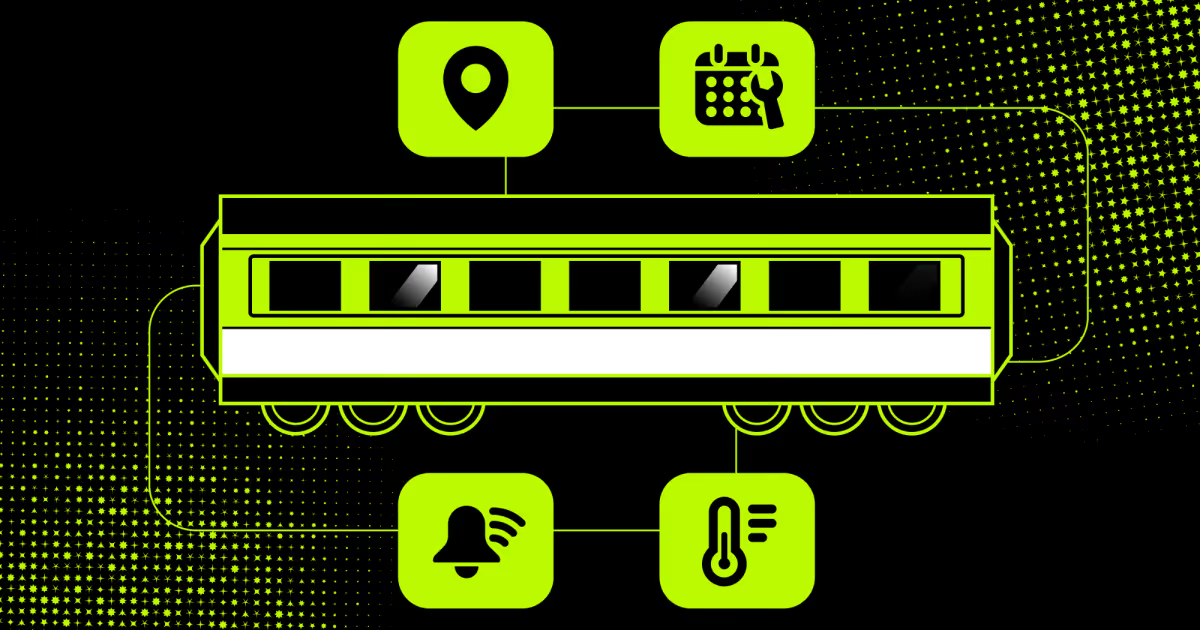
Sensors read speed, location, and harsh maneuvers dozens of times per second. Hardware installed in the vehicle streams data to a cloud dashboard in near real time. A sudden brake or a sharp turn gets logged the instant it happens, tagged with route and timestamp. You end up with a location-aware behavior record, not a guess based on a driver's word.
Video telematics and dash cams.
Cameras add a visual layer sensors can't replicate. In-cab footage runs through computer vision models trained to spot distraction, drowsiness, or a near-miss. Some systems flag the event locally, on the device, before it even reaches the cloud. You get proof, not just a data point, when a claim needs context.
Driver risk scoring.
Scoring pulls every signal into one number a dispatcher can actually use. Violations, telematics events, and incident history feed a weighted model that updates continuously. This is usually the centerpiece of any fleet driver risk management rollout, since it's the number everyone else reacts to. You get a ranked list instead of forty disconnected reports nobody reads.
Targeted training and coaching.
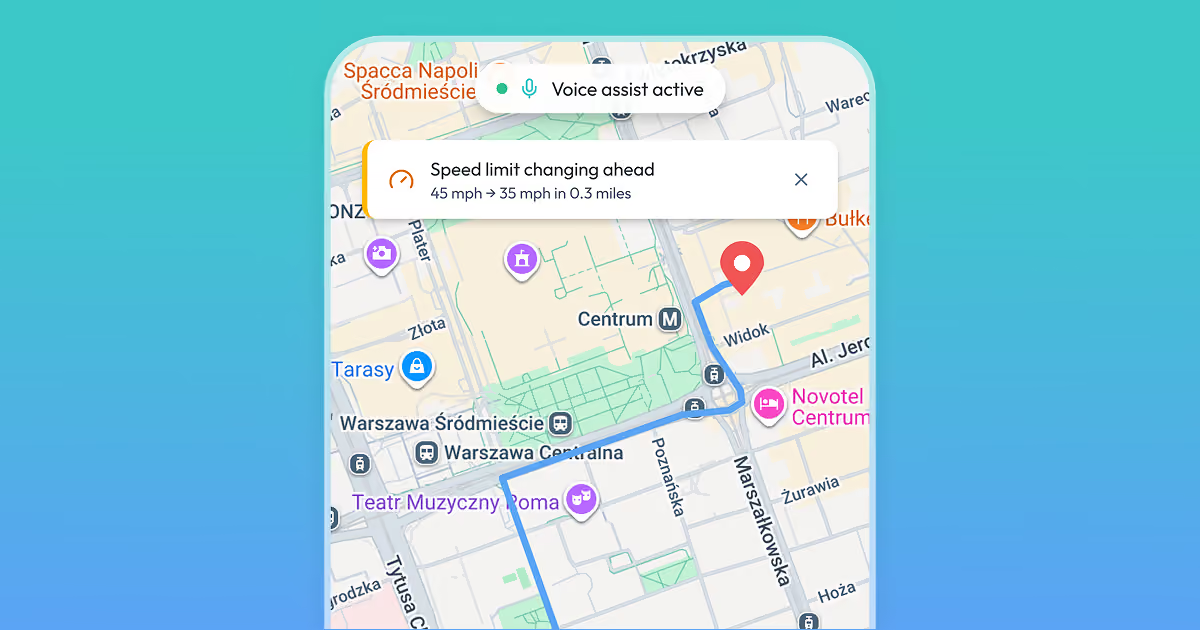
Coaching only works if it's specific, not generic. A flagged behavior triggers a short course matched to that exact weak point, delivered through the driver's own app. DriveIQ's in-cab coaching alerts do this in the moment: a voice prompt warns of a speed change ahead, and the system quietly suppresses alert types a driver keeps ignoring. That single feature cut fuel consumption by 12% just by adjusting to real driver behavior instead of blasting the same warning at everyone.
Analytics and reporting.
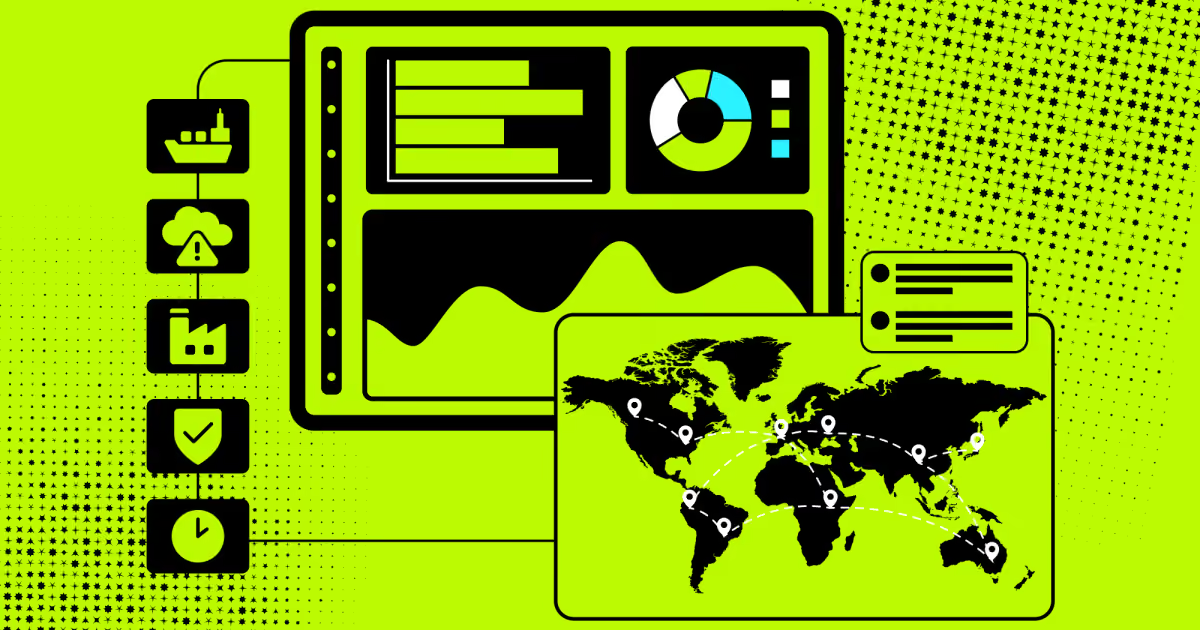
Dashboards turn individual scores into fleet-wide trends. Safety metrics, compliance gaps, and coaching completion rates roll up into one view for a safety manager. Most platforms run this on the same cloud backend as the scoring engine, so nothing needs a separate export. You get a single source of truth, not six spreadsheets that disagree with each other.
None of these six pieces earns its keep sitting alone. Driver risk management software exists specifically to wire them together into one loop.
Main features of driver risk management software
A solution's components define what it tracks. Its features define what a dispatcher and a driver actually experience day to day.
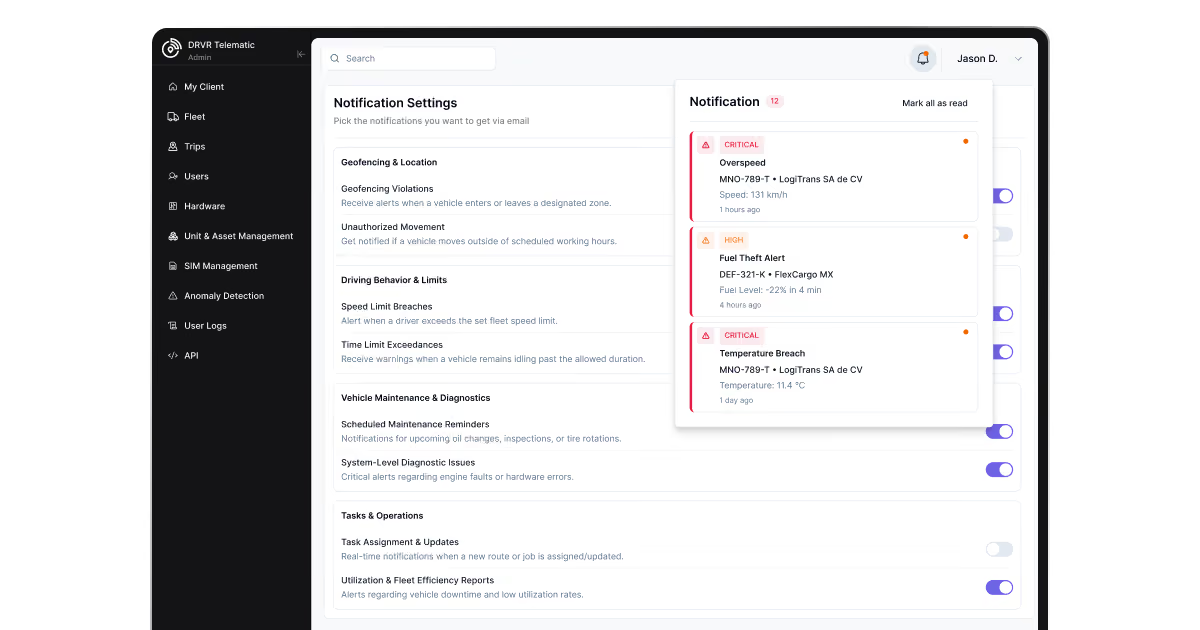
Real-time alerts. Risk events surface the moment they happen. By streaming GPS pings and event payloads over persistent WebSockets, telemetry backends trigger broadcasts to dispatcher dashboards. When telemetry devices log speed spikes, hard braking, or geofence breaches, the system evaluates threshold rules within milliseconds.
Automated MVR pulls. Credential checks run on a schedule, no manual request required. Integrated background-check APIs and DVLA/MVR validation endpoints routinely poll driver licensing databases. In our UK transportation project, our automated driver verification system executed scheduled identity and credential checks before drivers could take shifts. This allowed us to achieve 98.7% approval precision.
Peer-ranked scorecards. Drivers see how they rank against colleagues, not just a raw number. Rather than displaying passive, isolated safety scores that get ignored, the engine runs daily batch aggregation jobs to compute percentile rankings. Factoring in safety metrics like cornering or speeding against peer cohort baselines transforms static driver risk assessment data into competitive, engaging behavioral feedback.
Route-aware context. Every alert carries location and trip history attached automatically. Sensor inputs are continuously joined with historical geospatial vectors and map layers. Cross-referencing raw telemetry with route metadata (such as toll roads, blind intersections, or speed zones) ensures every incident log delivers instantly actionable operational context.
Adaptive coaching. The system learns which alerts a driver ignores and adjusts what it sends next. Machine learning models analyze driver interaction rates with mobile push notifications. If repetitive low-priority alerts are dismissed without behavioral change, the rules engine escalates critical safety reminders while suppressing redundant noise, delivering targeted driver risk reports directly to fleet supervisors.
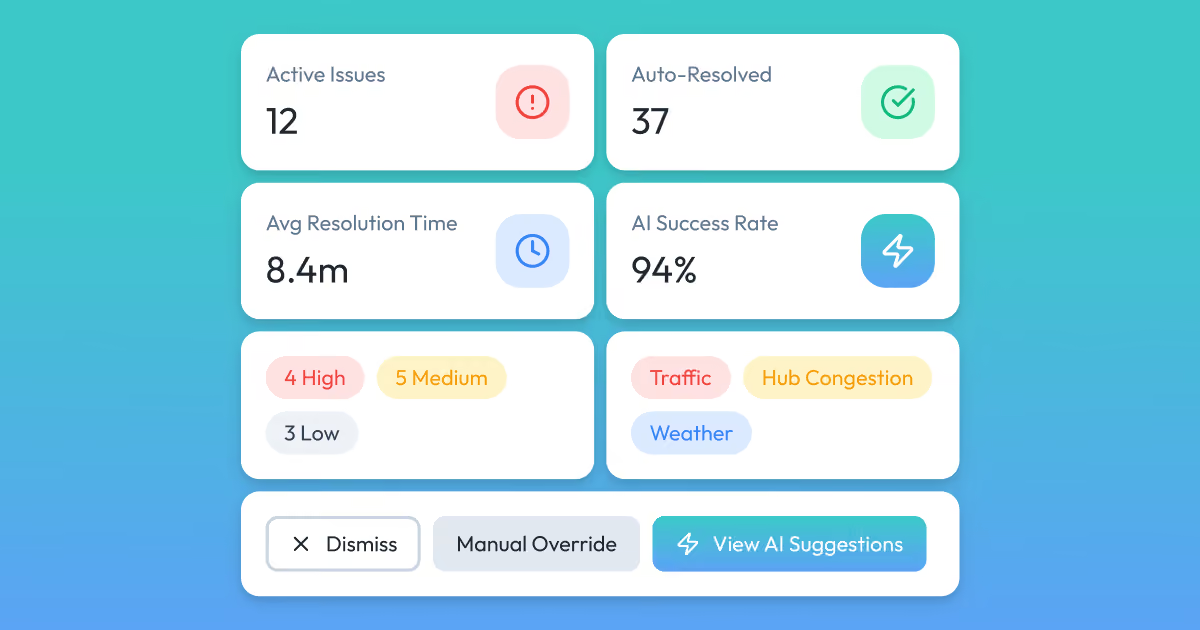
Exception queues. High-risk events jump the line ahead of routine, low-priority flags. Event streams feed into priority queues where severe anomalies bypass standard polling buffers. Dispatchers see urgent events pinned to the top of their queue instantly, ensuring critical driver risk management solutions remain proactive rather than reactive.
Each feature above solves a narrow problem on its own. Combined, they're what separates a working safety program from a pile of unread reports.
Best driver risk management software
Picking a platform off a features list rarely reveals what matters. We tested seven driver risk management software options against criteria that actually predict success on real fleets.
Five tests shaped these scores. We built them from patterns we've seen slow down real rollouts.
The adoption test checks whether the platform nudges drivers to engage, not just tracks them.
The root-cause test checks if exceptions get grouped by cause, not dumped flat.
The signal-drop test checks how the tool behaves once connectivity disappears mid-route.
The open-door test checks how much custom work it takes to connect existing systems.
The rollout-speed test checks how fast a driver actually starts using it, not just installs it.
Based on our evaluation, here are the options that make a difference.
Platform
Best for
Coaching adoption design
Root-cause clustering
Integration openness
Starting price
Fleetio
Maintenance-tied driver oversight
Basic, score-only
Limited
Moderate, published API
$4/vehicle/mo
Driveroo
Visual inspection evidence
Basic, alert-driven
Limited
Open API
$5/asset/mo
Geotab
Deep telematics and reporting
Configurable, no default nudge
Manual, via reports
Very open, large marketplace
Quote-based
Verizon Connect
Centralized tracking and compliance
Basic scoring
Limited
Moderate
Quote-based
Samsara
AI safety at scale
Automated coaching triggers
Strong, event-based
Moderate
Quote-based
Motive
Compliance-heavy workforce ops
Structured coaching programs
Moderate
Moderate
Quote-based
Azuga
Small fleets, driver buy-in
Gamified, peer-ranked
Limited
Moderate
$25/vehicle/mo
Each tool solves a different slice of driver risk. None solves every slice equally well. Here's what stood out in each one, based on our five tests plus core product details.
Fleetio.
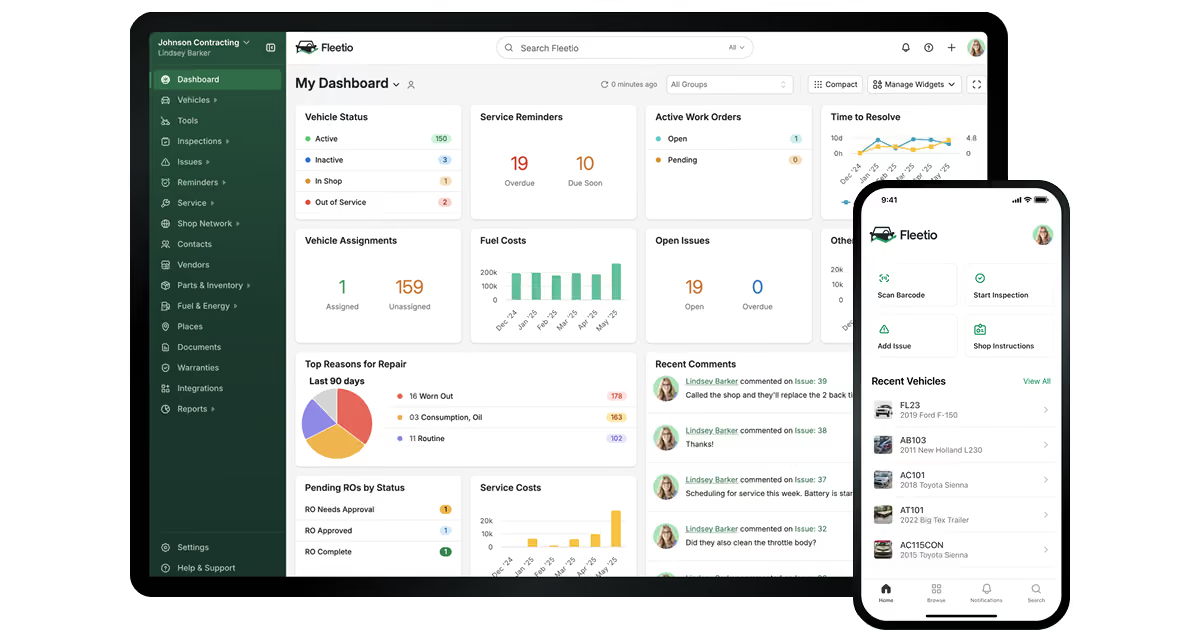
Fleetio ties driver management to maintenance and asset tracking in one system. Digital inspection forms feed straight into work orders. A driver's pre-trip check becomes a service reminder automatically. Parts inventory sits alongside driver records too. That closed loop suits operations where maintenance drives the whole workflow.
Pricing runs three tiers: Essential at $4 per vehicle monthly, Professional at $7, Premium at $10, all billed annually. A 14-day free trial needs no credit card.
On our tests, Fleetio scored weakest on coaching adoption. Scorecards exist, but nothing nudges drivers to check them. Root-cause clustering stayed manual, since inspections don't group by driving pattern. Integration openness landed moderate.
Driveroo.
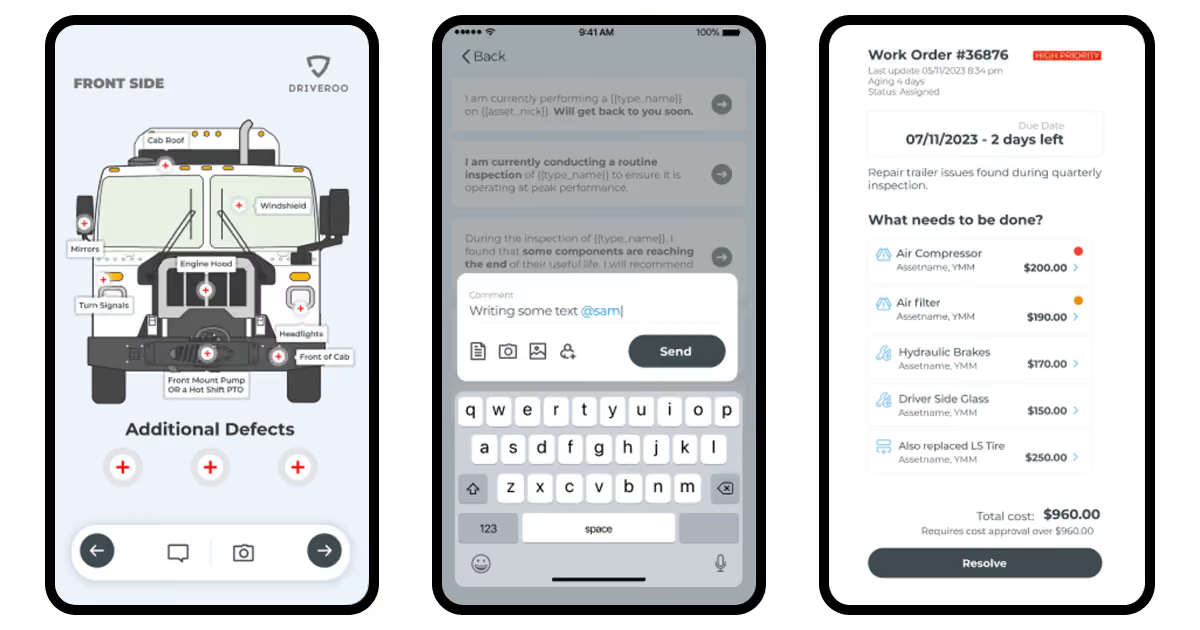
Driveroo built its reputation on visual inspection workflows. Drivers document vehicle condition with photos and video, not checkboxes someone rushed through. That evidence-based layer feeds work orders and reminders automatically. An open API and offline mobile apps round out the platform.
Three annual plans apply to this driver risk management software. Essentials starts at $5 per asset monthly, covering inspections and alerts. Pro runs $7 and adds preventive maintenance. Enterprise stays contact-sales for advanced features.
Driveroo led our signal-drop test outright. Offline mode kept syncing inspection data with zero interruption. Rollout speed also scored well, since drivers engage naturally through photo capture. Coaching adoption stayed reactive, though, tied to individual alerts.
Geotab.
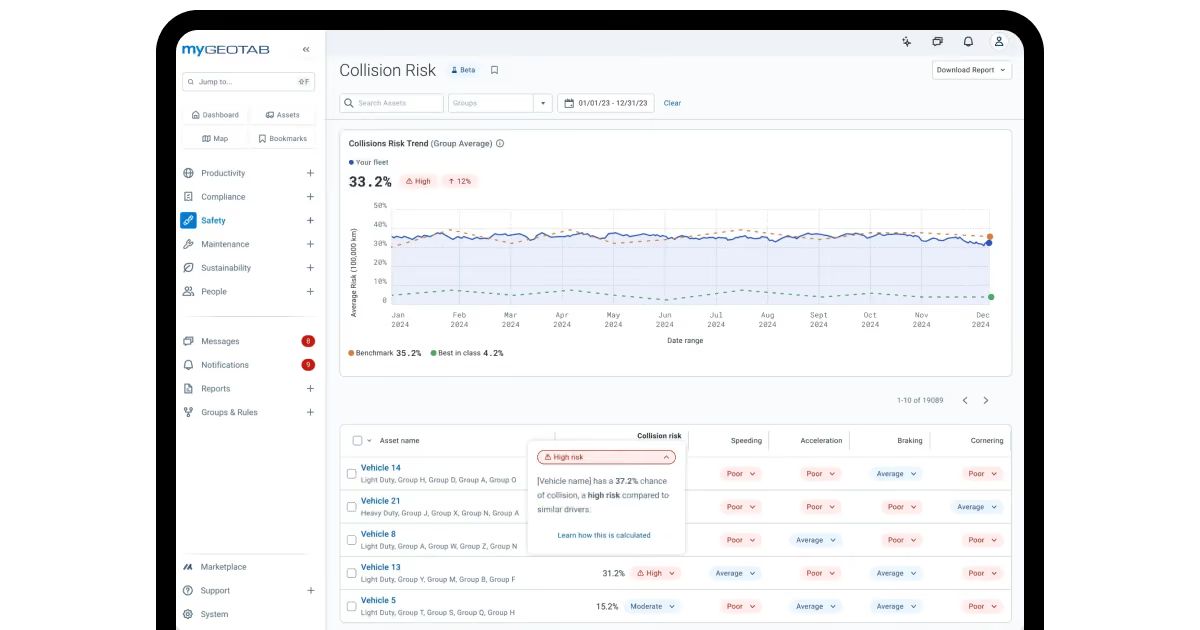
Geotab wins on raw telematics depth. It pulls granular engine and driving data directly from vehicle hardware, not summarized scores. A large marketplace of add-ons extends it into nearly any adjacent workflow you need. That openness makes it a foundation you build on, not a packaged experience.
Our open-door test ranked Geotab highest of all seven platforms. Its API and integrations connected without a single support ticket in trials. Root-cause clustering isn't built in natively, though. Someone still has to interpret raw reports manually.
Verizon Connect.
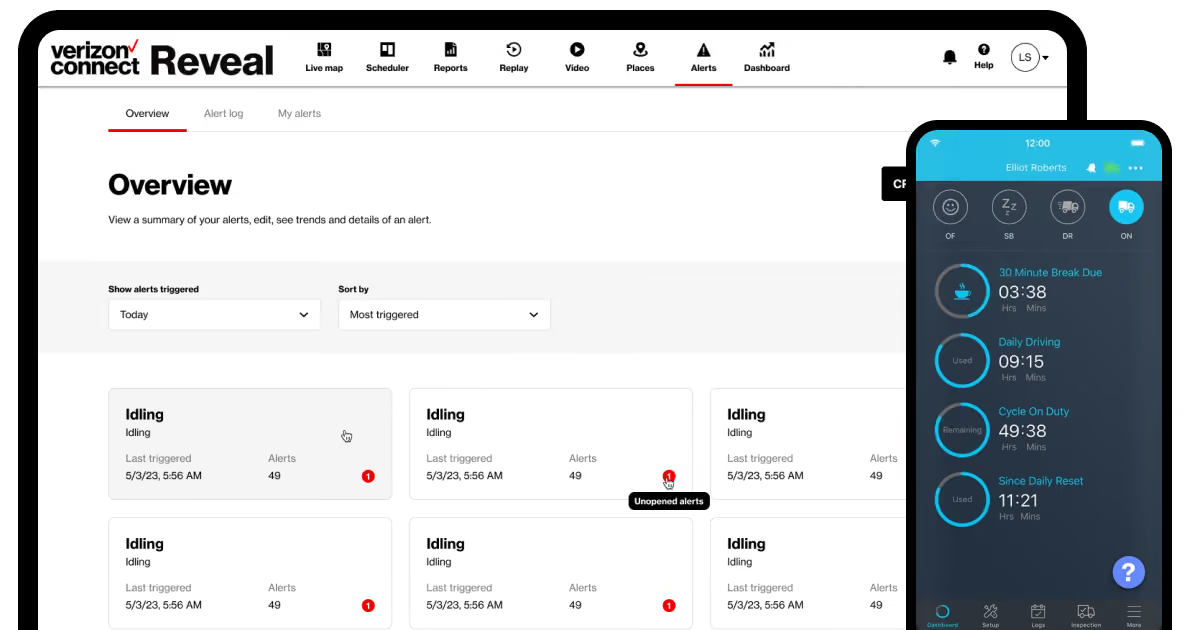
Verizon Connect centralizes GPS tracking, safety, and compliance under one vendor. Near real-time location, geofences, and route history give managers a live operational picture. Dash cams and AI features flag risky behavior as it happens. Maintenance tracking and compliance reports live alongside that tracking data.
Pricing remains quote-based and tied to fleet size, hardware, and the features you select.
Verizon Connect scored middling across our five tests of the driver risk management systems. Coaching adoption design felt thin: drivers see dashcam footage, not a clear reason to change habits. Root-cause clustering stayed limited to what compliance reports surfaced.
Samsara.
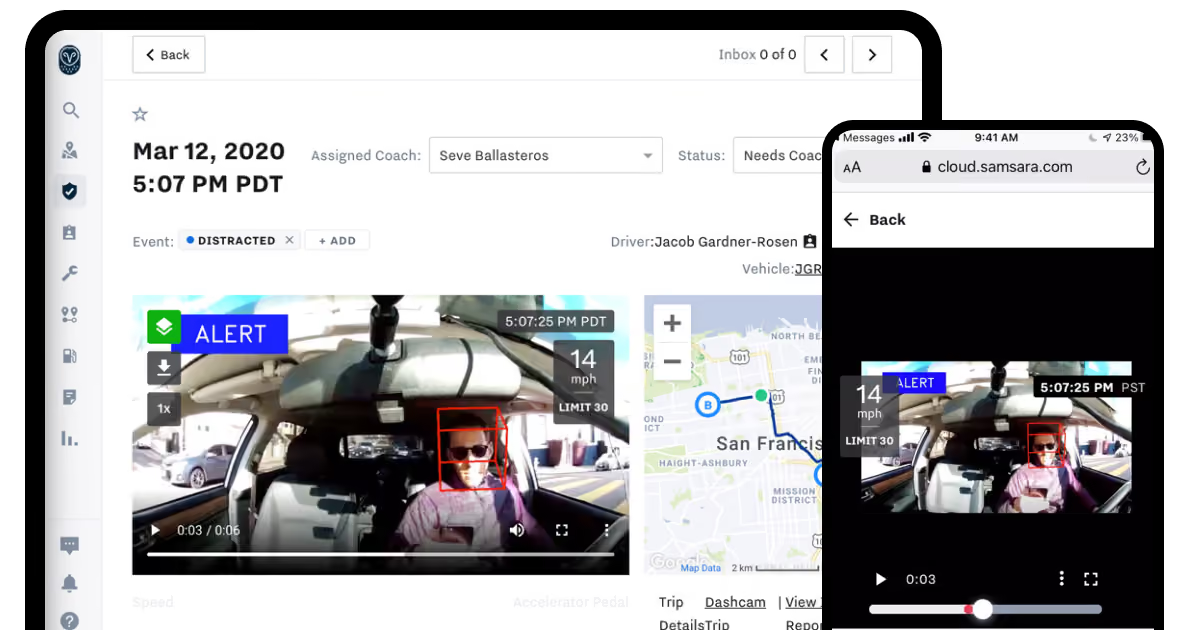
Samsara centers on real-time safety through AI video and dash cams. Risky events get caught and routed to coaching, which drove its lead on our root-cause test. ELD and compliance workflows sit alongside GPS tracking and routing, unifying telematics and safety.
Samsara doesn't publish pricing either. Costs typically scale with camera hardware and the safety feature mix you choose.
Coaching triggers here fire automatically once an event gets flagged, no digging required. That automation pushed Samsara to the top of our root-cause and rollout-speed tests. The tradeoff surfaced in cost: pricing runs high for smaller fleets.
Motive.
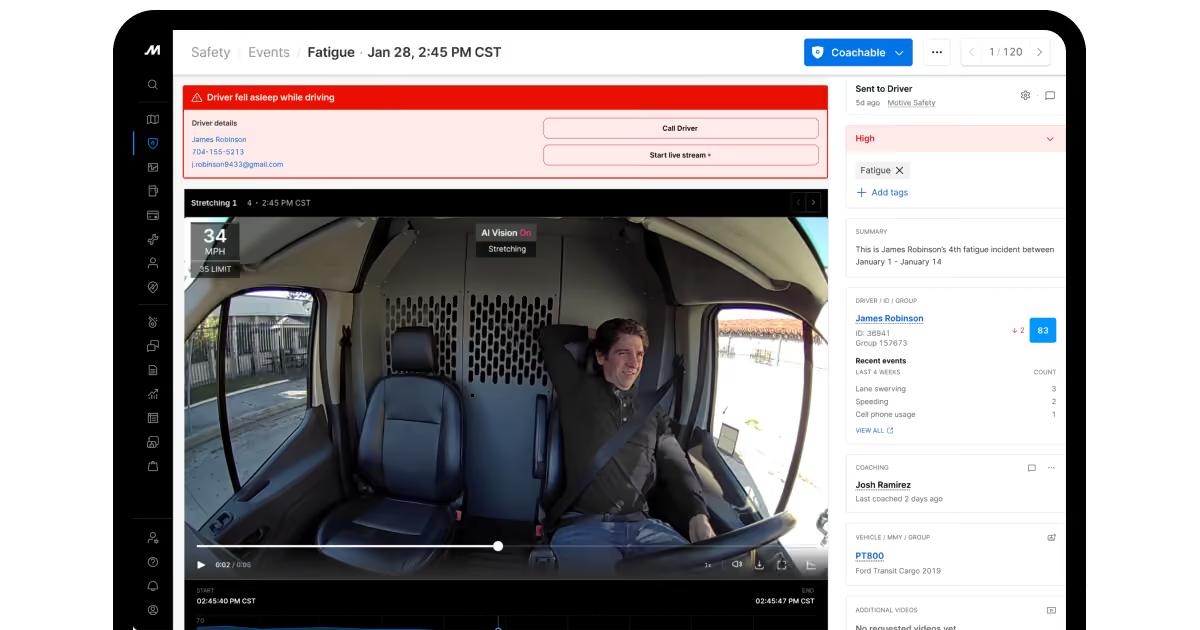
Motive, formerly known as KeepTruckin, bundles compliance, safety, and workforce management together. ELD support, hours-of-service logging, and inspections sit next to AI-powered fleet analytics. Coaching, training, rewards, and driver qualification extend it past a pure tracking tool. That breadth positions it as an operational hub, not a point solution.
Pricing isn't published. Its ELD product historically started near $25 monthly, with a free trial offered. It's a strong driver risk management platform for fleets juggling FMCSA rules.
Motive scored strong on structured coaching for regulated trucking. Our adoption test showed decent engagement, though less gamified than Azuga's. Root-cause clustering landed moderate: analytics exist, but pattern-grouping isn't as automatic as Samsara's.
Azuga.
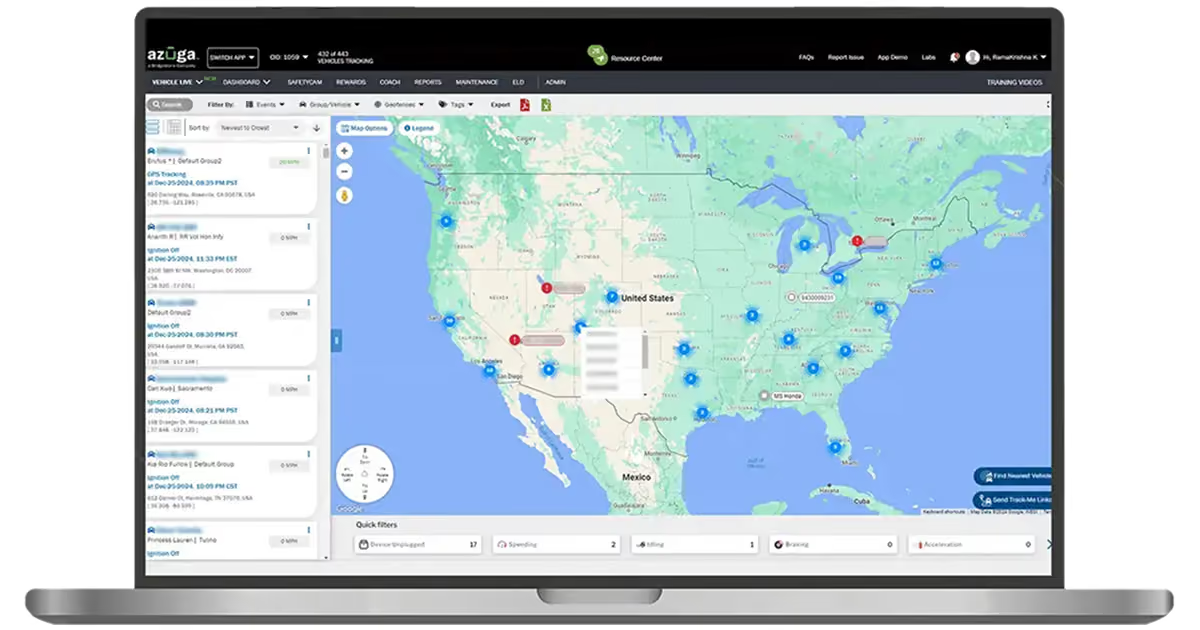
Azuga takes a pragmatic, transparent-pricing approach built for smaller and mid-market fleets. GPS tracking, driver scorecards, and AI dashcams come standard. Its differentiator is turning safety into something drivers can see and improve through rewards.
Three tiers apply: BasicFleet at $25, SafeFleet at $30, CompleteFleet at $35 per vehicle monthly. SafetyCam AI adds roughly $50 more.
Azuga topped our adoption test by a clear margin. Peer-ranked scorecards drove real engagement, echoing what we saw firsthand on DriveIQ. Root-cause clustering stayed basic, and its API felt the most limited of the seven we tested.
A ready-made tool rarely fits every fleet perfectly. Certain situations make that gap expensive fast: a workflow no vendor anticipated, role-based access across many stakeholder types, or telematics data scattered across mismatched vendor formats.
At COAX, we build the missing piece, whether that's a dashboard, a mobile app, or a full driver risk management solutions platform layered on what you already run. Driven Connect shows this pattern well. That UK operator platform launched its MVP in five months, then grew past 400 operators as requirements outgrew standard booking software.
Often, it’s custom software development for transportation, not a licensed platform stretched past its design, that makes a difference. COAX Software operates under ISO 27001 and ISO 9001 frameworks, which matters when shipment and contract data need real governance.
We approach AI the same practical way. Wrapping proven models like AWS Forecast ships faster than training one from scratch. LLMs earn their place turning messy paperwork into structured, queryable data. Handing a model live routing decisions with no human sign-off stays the overhyped part. Most fleet data still isn't clean enough for that.
How to choose the right driver risk management software?
Choosing right starts with your operating model, not a features list. We've battle-tested this fleet playbook across our projects. Skip generic software. Match open APIs, driver adoption, and actual route risks.
Start with your fleet size and growth curve. A fifteen-vehicle service fleet doesn't need enterprise-grade telematics depth. A five-hundred-vehicle carrier can't run on a maintenance-first tool alone. Buy for where you'll be in eighteen months, not today.
Map your existing systems before you shortlist anything. If a TMS or ERP already runs your operation, prioritize open APIs. Flashy dashboards matter less than clean data flow. Ask any vendor exactly how they handle mismatched formats.
Weigh your regulatory exposure honestly. Cross-border carriers face different HOS and customs rules than regional fleets. A fleet driver risk assessment needs to reflect your actual routes, not a generic template. Test a platform's compliance module against real conditions.
Pilot with real drivers, not a dispatcher demo. Coaching only works if drivers actually engage with it. Raw scores get ignored fast. Peer benchmarking and gamified formats tend to land better in practice.
Watch how a platform handles exceptions, not normal days. Any tool looks fine when nothing's wrong. The real test is a missed delivery or a stalled truck. Ask a vendor to walk through their exception flow live.
Check multi-tenant structure if you manage fleets for others. Partner architecture matters more than any single feature here. A platform without proper account isolation forces manual workarounds as partners multiply.
Price the hidden costs, not just the subscription line. Hardware, integration hours, and training all add real cost. A cheaper per-vehicle rate can lose once integration hours get counted.
One more thing worth flagging: don't underweight onboarding speed against your calendar. Some platforms take weeks to configure properly. Others run live within a day. Switching systems mid-peak-season can cost more than the software itself.
The deeper issue is that most vendors sell a general-purpose driver risk assessment layer. Your operation likely isn't general-purpose. The gap between "close enough" and "actually fits" tends to show up exactly where your business is most unusual, whether that's a niche compliance rule, an unconventional booking flow, or a data source no platform expects.
At COAX, we are on the engineering side of that decision. We help you evaluate platforms against your actual operating model, integrate the one that fits, and build the custom layer that off-the-shelf tools don't cover. This goes from a predictive ETA engine, an emissions calculator, to analytics and AI on top of your existing infrastructure. If your current platform is close but missing the piece that actually moves your metrics, that's usually where we come in.
As part of our logistics software development services, COAX integrates any of these platforms into existing transport operations. We handle complex API integrations and build custom analytics layers on top of standard telematics feeds. We can also extend platform capabilities where the off-the-shelf implementation falls short. The integration work is where the operational value of any driver risk management solutions gets unlocked.
How to build a future-proof driver risk management strategy?
A strategy that lasts combines the right software with habits that actually stick. Here's what separates fleets that improve over time from ones that stall after rollout.
Track metrics that predict risk, not just report it.
Harsh-braking frequency, speed variance, fatigue windows, and near-miss counts all matter more than crash totals. A solid driver risk management solution surfaces these weekly, not quarterly. If a metric doesn't change a decision, drop it.
Run a driver risk assessment before you pick any tool.
Map your current gaps first: fatigue, speed, distraction, or fragmented data. That assessment should shape which features you actually need. Skipping it means buying capability you'll never use.
Communicate clearly, or coaching gets ignored.
Drivers who feel watched disengage fast. Drivers who understand why a signal matters tend to act on it. Frame every alert around a reason, not a warning.
Build rewards into the system, not just scores.
Our DrivenPeople solution grew its driver base past 4,700 registered drivers through referral bonuses and milestone rewards. Drivers earned payouts for reaching their first 100 or 200 hours worked. That structure turned participation into something drivers wanted, not something imposed on them.
Automate the reporting nobody wants to do by hand.
On GrandBus, automated route reports cut reporting time by roughly 35 minutes per route. Passenger counts, ticket income, and segment breakdowns generated instantly instead of manually. That freed dispatchers to focus on actual exceptions.
Review driver risk reports on a fixed cadence.
Weekly works for most fleets, monthly for smaller ones. Reports that sit unread defeat the entire point of collecting them. Assign someone specific to own that review.
Treat non-software habits as part of the strategy too.
Regular skills checks, clear escalation paths, and consistent coaching conversations matter as much as any dashboard. Software surfaces the signal. People still act on it.
Revisit thresholds as your fleet changes.
A scoring model tuned for twenty vehicles won't fit five hundred. Route complexity, driver tenure, and seasonal patterns all shift risk baselines over time.
That combination, clean data, clear communication, and habits that reinforce each other, is what makes driver management software hold up past the first year. Driver risk management isn't a one-time rollout. It's a loop you keep tuning.
Building that loop usually means more than picking software off a shelf. It means deciding what to automate first, what to measure, and what your team will actually use.
If you're weighing where to start, or which piece of your current setup needs custom work, we're happy to talk through it. No pitch required, just a second set of eyes on your operation.
FAQ
What is a high risk driver, and how does software actually flag one?
Someone whose patterns, not one incident, predict a future crash. Software flags this through combined signals: frequent hard braking, speeding, fatigue windows, and low scorecard engagement. On DriveIQ, fatigue-and-HOS modeling caught risk before violations happened. A single bad day rarely triggers flags. Repeated patterns across weeks do, which is the point.
How much does business driver fleet risk management software actually cost per vehicle?
Pricing varies widely by feature depth and fleet size. Business driver fleet risk management software ranges from $4 per vehicle monthly for maintenance-focused tools to $30 or more for AI-driven safety platforms. Enterprise options often hide pricing behind sales calls entirely. Budget for hardware, installation labor, and training too. Vendors rarely quote those upfront, and they add real cost beyond the subscription line.
Can I switch driver risk management software without losing my historical data?
Usually, yes, if the vendor supports data export. Ask any platform for a sample export before signing anything. Closed schemas make migration painful and slow. We build systems with open data structures specifically so clients avoid permanent lock-in later. Before switching, confirm what format your telematics history exports in, since some platforms strip context during export.
















































































_.avif)









%2520explained.avif)

We are interested in your opinion